The Pivotal Point of View Commentary
The backdrop:
-
A sea of red across and within global equity and bond markets while energy, treasury yields, USD, and inflation continue to rise
-
Commodities continue to be pushed higher due to supply concerns stemming from the war in Ukraine to renewed Covid-driven shutdowns in China. Natural gas led the way higher again, increasing 28.4% in April and 94.2% YTD
-
Reacting to continued commodity inflation and worries the Fed might be behind the curve, the U.S. 10 Year Treasury yield continued higher from 2.33% to 2.89% after finishing 2021 at 1.51%. The 2 Year increased from 2.28% to 2.68%, though helping to retreat from a temporary and ominous yield curve inversion
-
The U.S Dollar rallied another 4.7%, its biggest monthly gain since January 2015
-
Most broad global equity indices were down while the energy-heavy FTSE 100 was up 0.8%, increasing its YTD gain to 3.7%
-
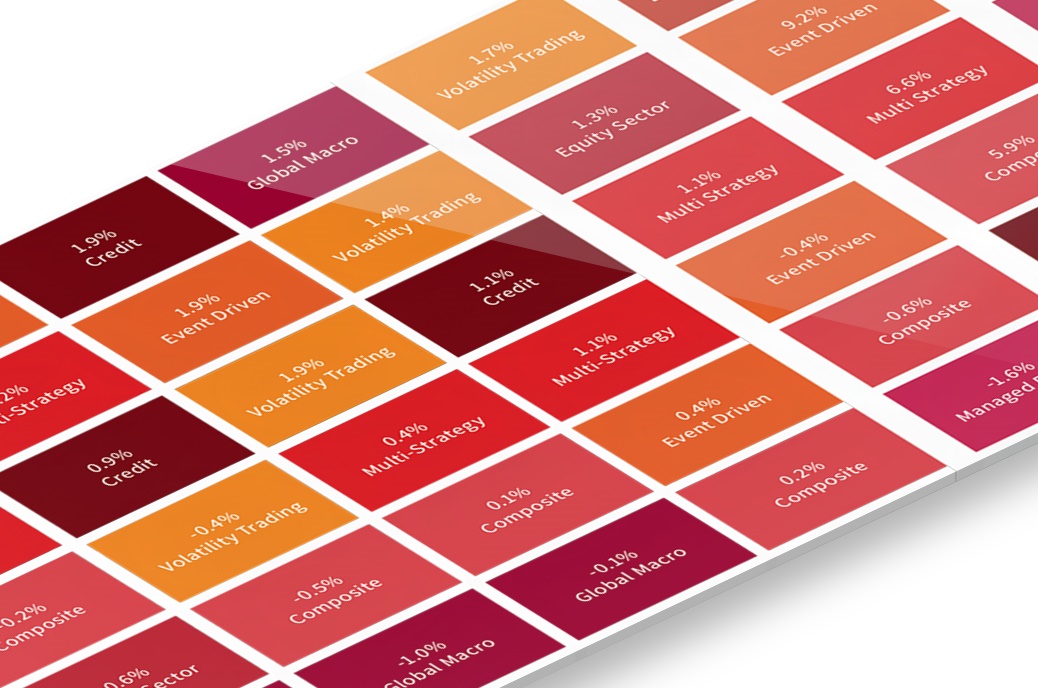
For the first time since tracking began in 2018, all 20 PivotalPath custom thematic baskets were negative for the month, with the largest losses coming from the Covid-19 Vaccine Developer SMID-Cap Basket (-27.1%) and Small-Cap Biotech (-24.8%)
Managed Futures and Global Macro continue to ride the trends higher:
-
Managed Futures generated another 4.5% in April, leaving it +14.6% YTD while Global Macro gained 3.5% and is up 10% YTD
Hedge funds broadly continue to deliver:
-
The PivotalPath Composite Index continues to diverge from traditional asset classes. Its 12-month beta of 0.11 to the S&P 500 is the lowest since December 2017 and the 2nd lowest since November 2003
-
The PivotalPath Composite’s monthly outperformance of 8.5% relative to the S&P 500 is the 8th largest on record dating back to January 1998 which spans 192 months
-
The YTD or 4-month relative outperformance between the Composite and S&P 500 ranks 18/188 of all 4 month rolling periods of outperformance
The equity impact:
-
Even the Equity Diversified U.S. Long/Short Fundamental Index has reduced its rolling 12-month beta to 0.35, the lowest since the fall of 2018, helping mitigate losses seen at the equity index level
-
Equity Sector focused strategies, however, struggled mightily with few places to hide, demonstrated by:
-
Equity Sector: Healthcare Index which fell 5.7% in April and is down 14.9% YTD
-
Equity Sector: Technology/Media/Telecom which lost 4.8% in April and is down 14.3% YTD
-
TMT and Healthcare comprise the bottom of the 45 sub-strategies we cove
-
Dispersion and Divergence in Alpha generation:
-
Dispersion across all funds level remains elevated at 5.7%; prior to the volatility brought on by Covid in February of 2020, that would have been the highest print since the tail end of the financial crisis in 2009
-
Dispersion at these levels continues to be a healthy sign as managers across strategies have the ability to generate outperformance and meaningful alpha, making strategy and manager selection that much more important