For allocators evaluating hedge fund performance, context matters.
Every month, on behalf of over $300B in client hedge fund capital, PivotalPath tracks over 2,500 institutionally-relevant hedge funds, spanning >$3T of industry assets. Our monthly report contextualizes these data points, including analysis of hedge fund performance, as well as 12-month rolling alpha across high-level strategies.
Key takeaways:
- The PivotalPath Composite Index declined 0.9% in October, leaving the Index +3.6% YTD. The Index continues to generate positive alpha of 3.2% relative to the S&P 500 (S&P) over the last 12 months.
- PivotalPath’s Dispersion Indicator reading of 2.9 in October was back below its historical monthly average of 3.1 after hitting a 46-month low in April. This comes after a multi-year period in which it consistently sat at extreme historic highs.
- As we noted in a recent Reuters article here, US Equity Long/Short Fundamental funds exposure to the S&P continues to remain at the lowest levels since September of 2017 and December of 2009 before that. Exposure remains far below the levels seen in 2019-2021 when it averaged above 0.5 and lower than its historical mean of 0.43 since January of 2008.
- In last month’s PPOV, we mentioned Managed Futures’ sizable short exposure to Treasury Futures. We then conducted a deeper dive here. We found that current exposure is in a deep negative territory (since Feb 2021) to a level unseen since 2007, albeit with apparently more persistence this time – things barely changed since March 2023, when Treasuries rallied suddenly and massively in response to the regional banking turmoil.
Download this month’s PPOV
To access this month’s PPOV PDF please provide the following information.
2023 Hedge Fund Performance
Strategy Highlights
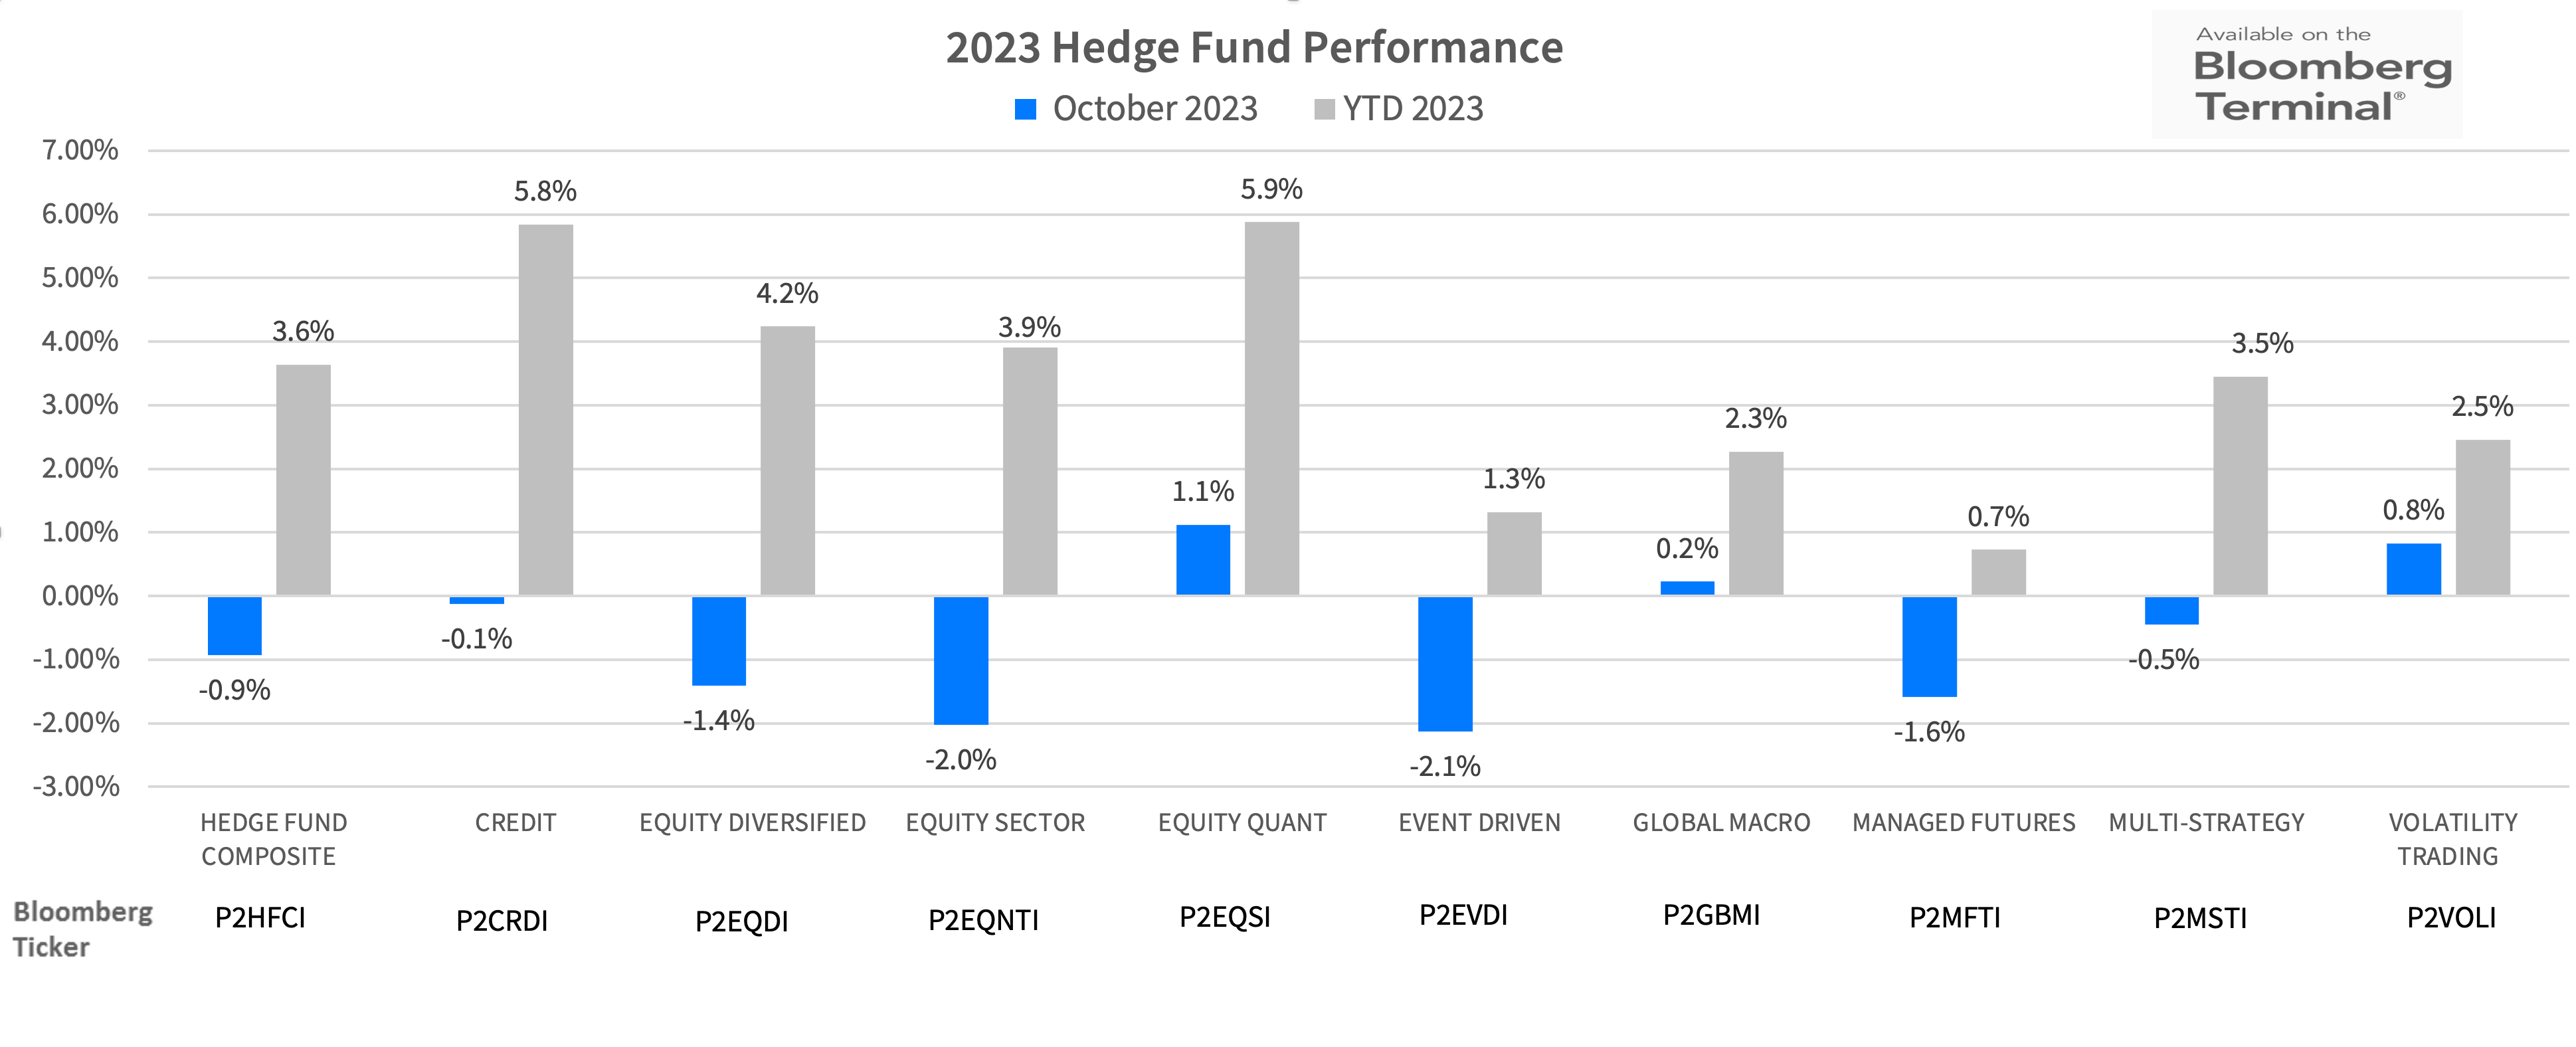
- The major Hedge Fund strategy Indices, while outperforming equity indices, were mostly negative for the month.
- The Equity Quant and Volatility Trading Indices generated positive returns of 1.1% and 0.8% respectively, while Managed Futures, Equity Sector and Event Driven Indices declined the most.
- YTD, all major Hedge Fund Indices remain positive with Equity Quant and Credit Indices leading the way, +5.9% and +5.8% respectively.
What we’re seeing:
The PivotalPath Equity Quant Index continues to generate consistent returns since 2021 after 4 years of lackluster performance, leading all major hedge fund indices over the past 12 months with a return of 9.3%. Over the last 3 years through October, the Index is second to only Managed Futures annualizing returns of 9.2%.
Pivotal Context
The Backdrop: Interest Rates and Global Demand
- Continued and increased concerns of a global slowdown, higher interest rates for longer and the potential for a hard landing produced a risk off posture. And wars in Israel and Ukraine added fuel to the fire. The market reaction to the heightened uncertainty drove the S&P down 2.1%, the Nasdaq 2.8%, the DJIA 1.4%, and the Russell 2000 6.9%. This was the 3rd consecutive month of significant declines coming after most equity markets peaked in July. The Russell 2000 and DJIA are now negative for the year at -5.6% and -0.3% respectively.
- The higher for longer and hard economic landing scenarios fueled the US 10-year Treasury yield to increase again from 4.57% to 4.93% in October, though the US 2-Year yield only increased from 5.04% to 5.09%.
- The economic concerns and higher rates caused continued broad sector declines. Biotech (XBI) declined 9.3% in October after declining 7.8% in September. Consumer Discretionary (XLY) gave back 5.52% and Energy (XLE) declined 5.75%.
- Volatility continued to climb with the VIX finishing at 18.14 vs the relatively low levels of 13.57% in August and 13.63% in July.
Factor Performance (we use the Dow Jones U.S. Thematic Market Neutral factors as a proxy):
Results for the month were mixed:
- Size and Value declined 3.3% and 2% respectively and are down 5.9% and 10% in 2023.
- All other factors were positive for the month. Low Beta +6.7%, Momentum +4.3% followed by Quality +2.7% and Growth 2%
- Momentum, while positive for the month, remains down 3.8% YTD
Alpha Leaderboard
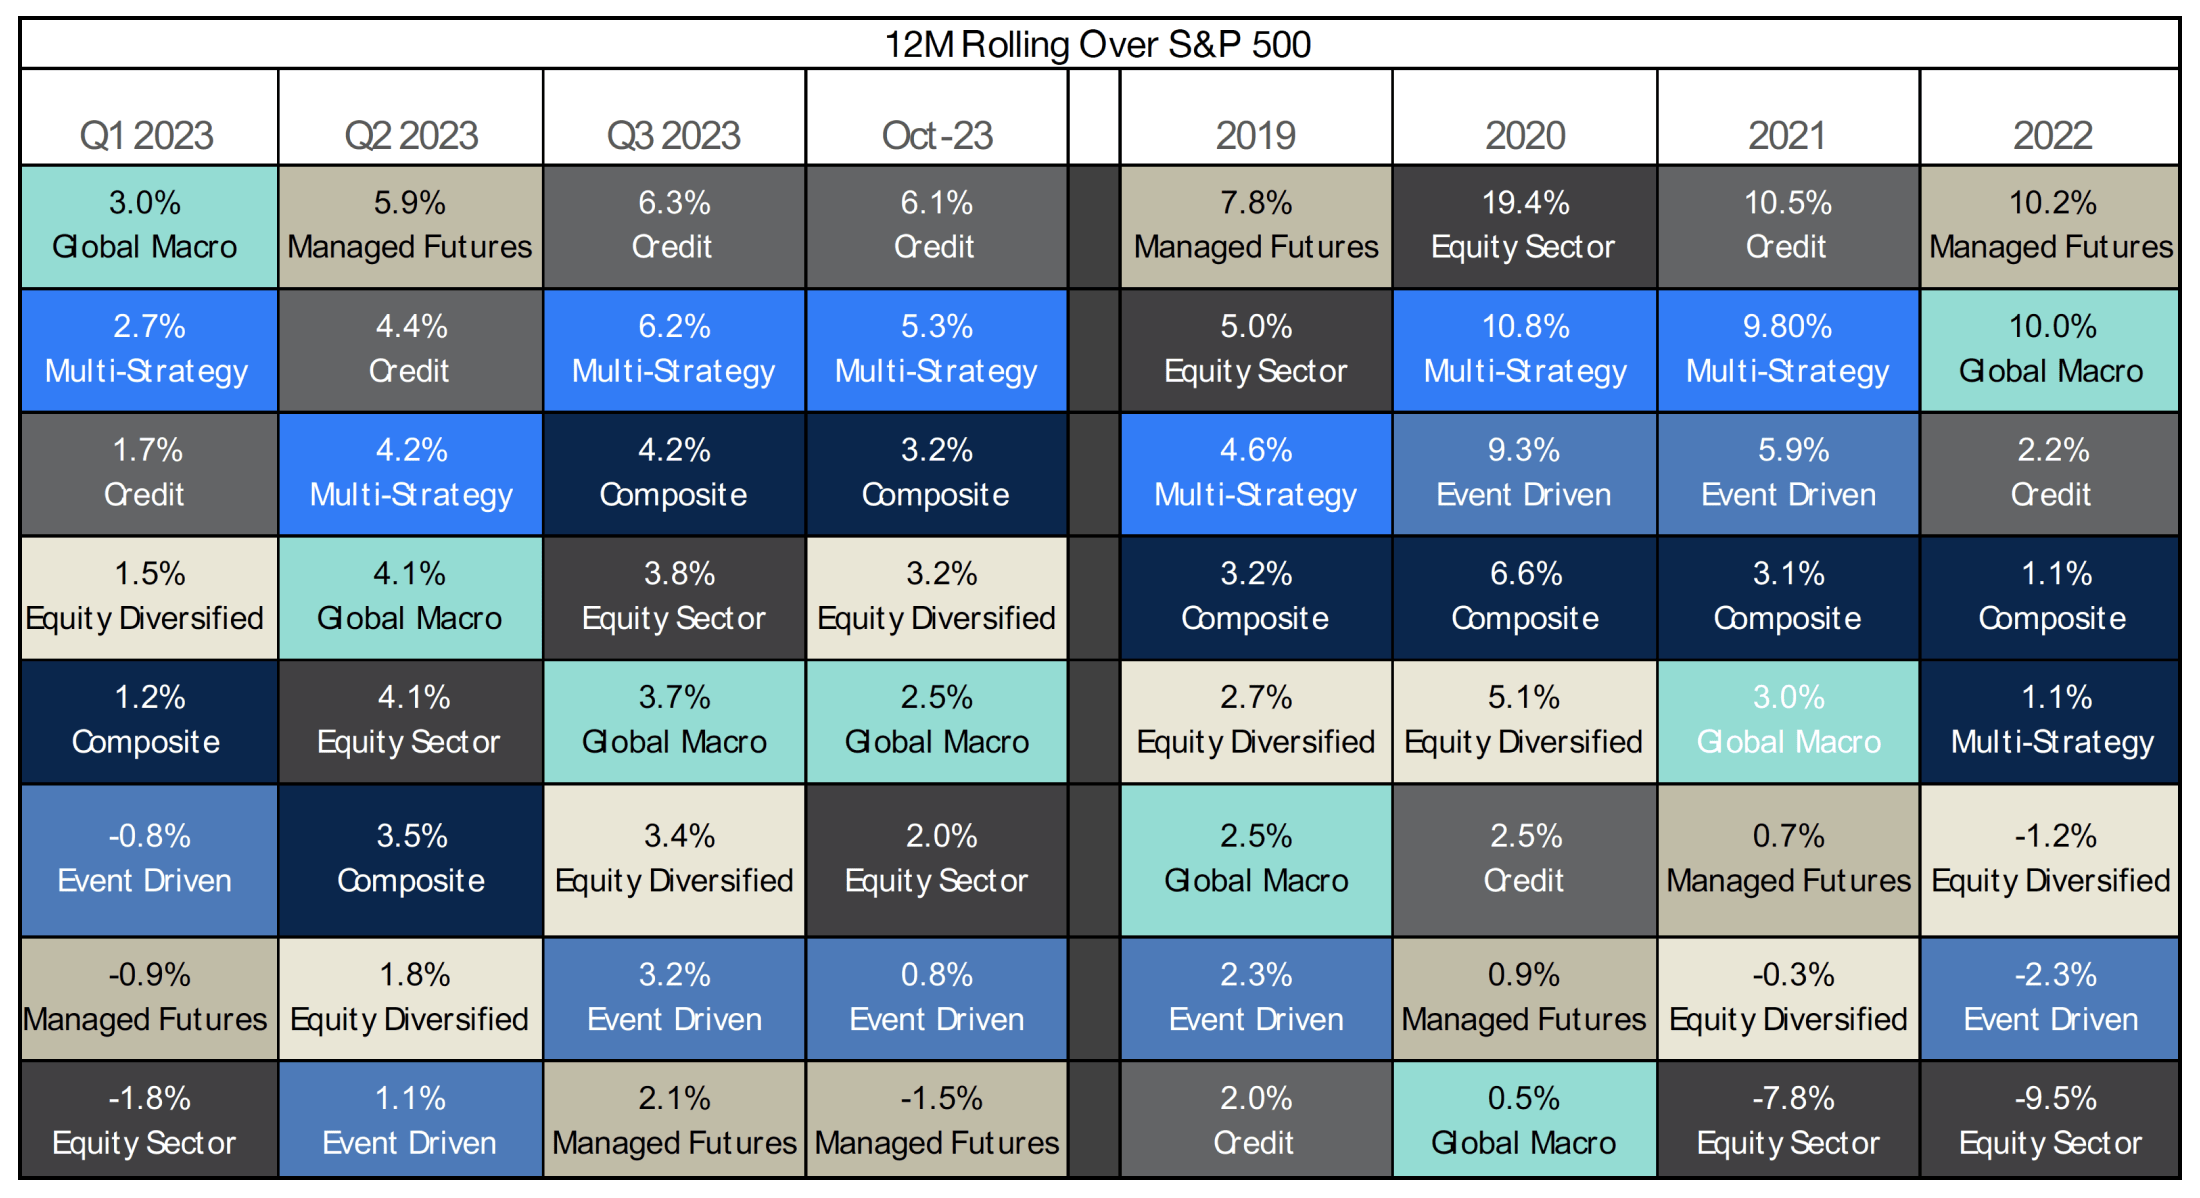
- For the 12-month rolling period ending October, Credit again produced the highest Alpha. Multi-Strategy followed once again.
- Managed Futures produced the lowest alpha which was negative for the first time since March of this year.
The chart below depicts alpha generation for each PivotalPath Index, ranked from high to low. Each strategy is color-coded for easy tracking. For the 12-month rolling period ending in June, the Managed Futures Sector continued to rise in the rankings and is now back at the top of the group.
What we’re seeing:
The PivotalPath Composite Index continues to generate positive alpha of 3.2% relative to the S&P over the last 12 months. Its rolling 12-month beta to the S&P remains historically low since Q2 of 2022, and the lowest sustained level since 2004.
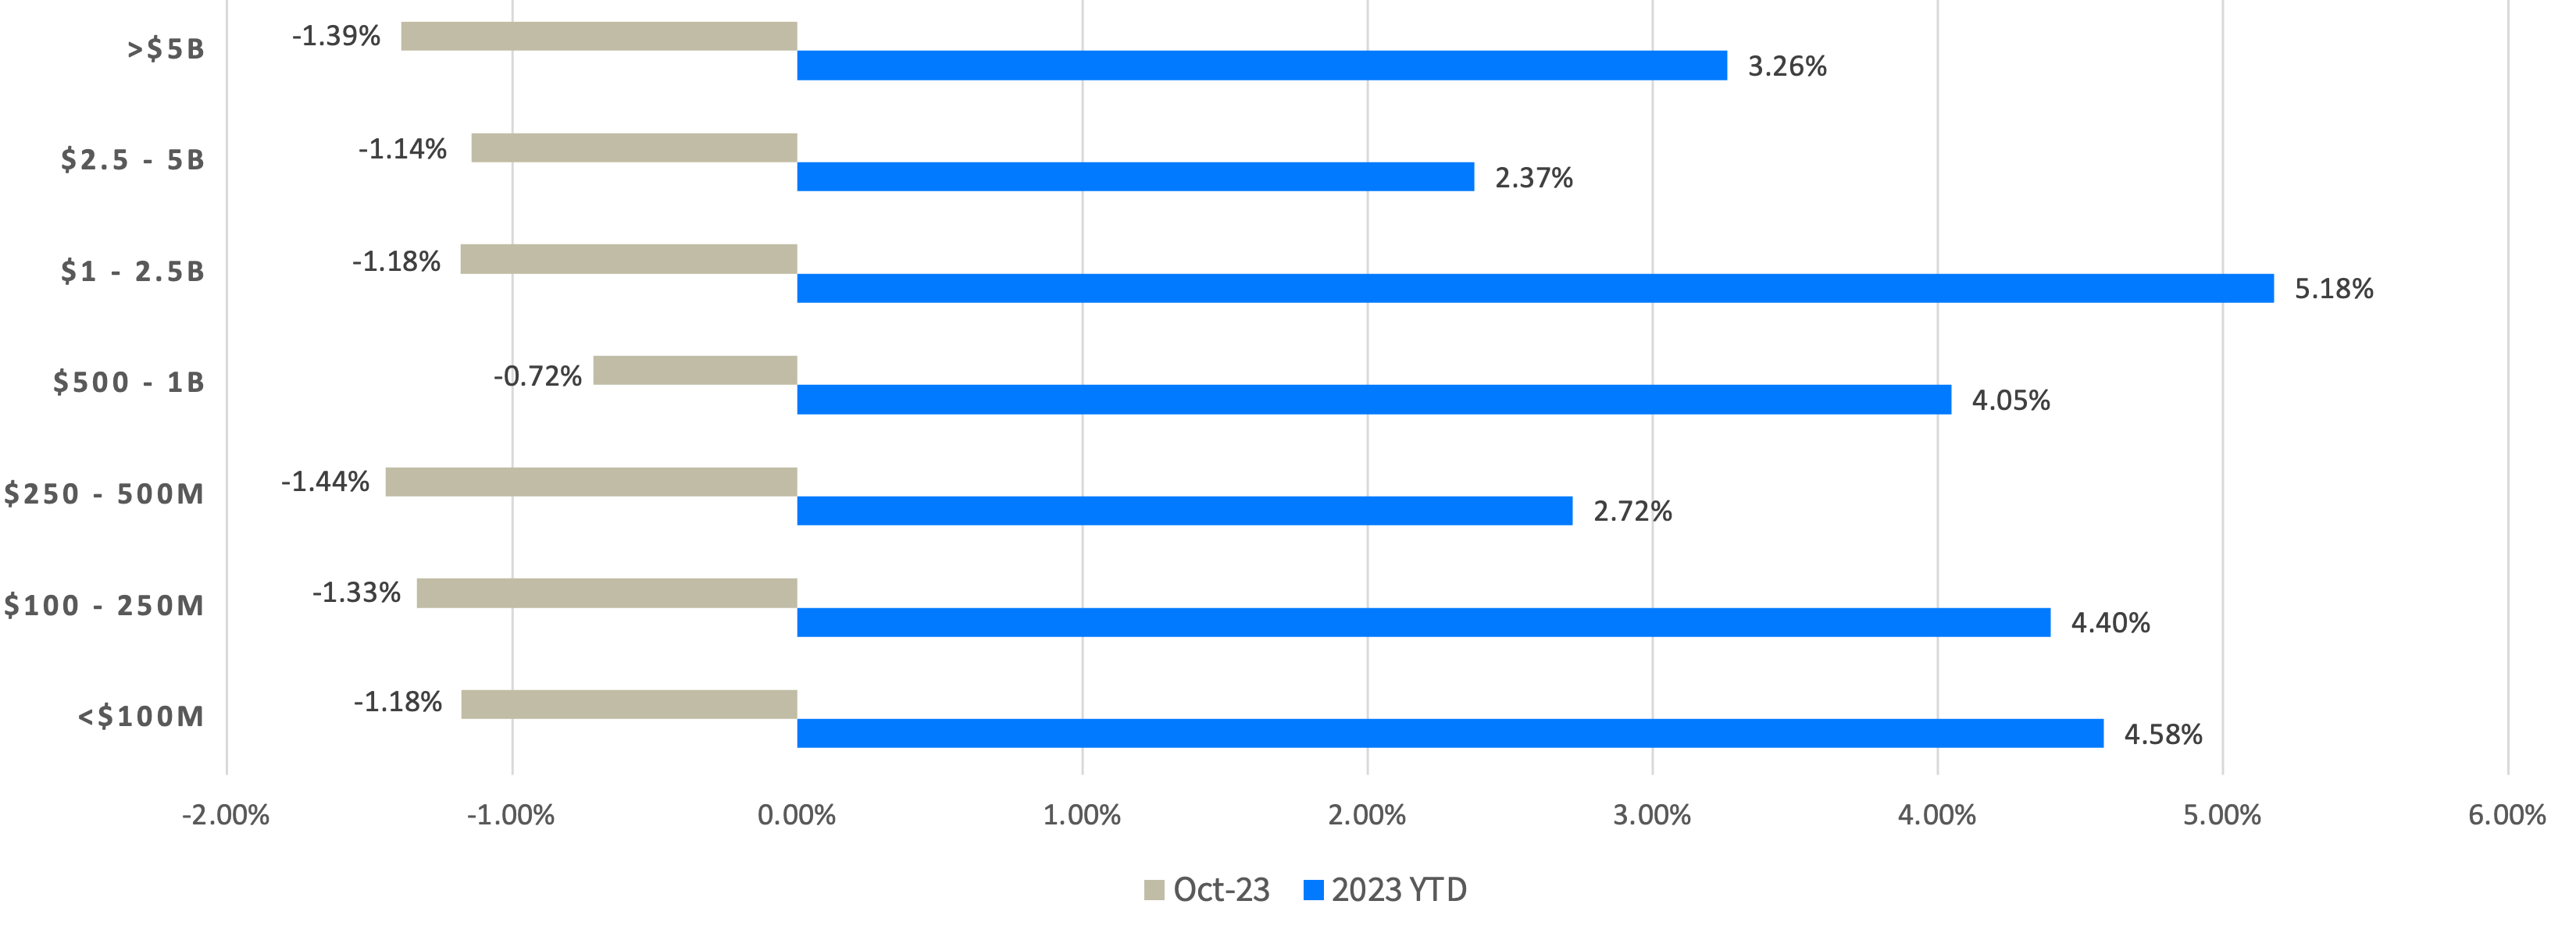
Average Performance by AUM
- As illustrated in the graph below, on average, all AUM bands declined in October.
- The $0.5B-$1b band performed marginally better due to strong performance in Equity Long Short funds.
- YTD, all AUM bands are positive with the $1B-$2.5B and <$100M bands continuing to lead the way.
For fund details, subscribe to PivotalPath’s suite of products here