For allocators evaluating hedge fund performance, context matters.
Key takeaways:
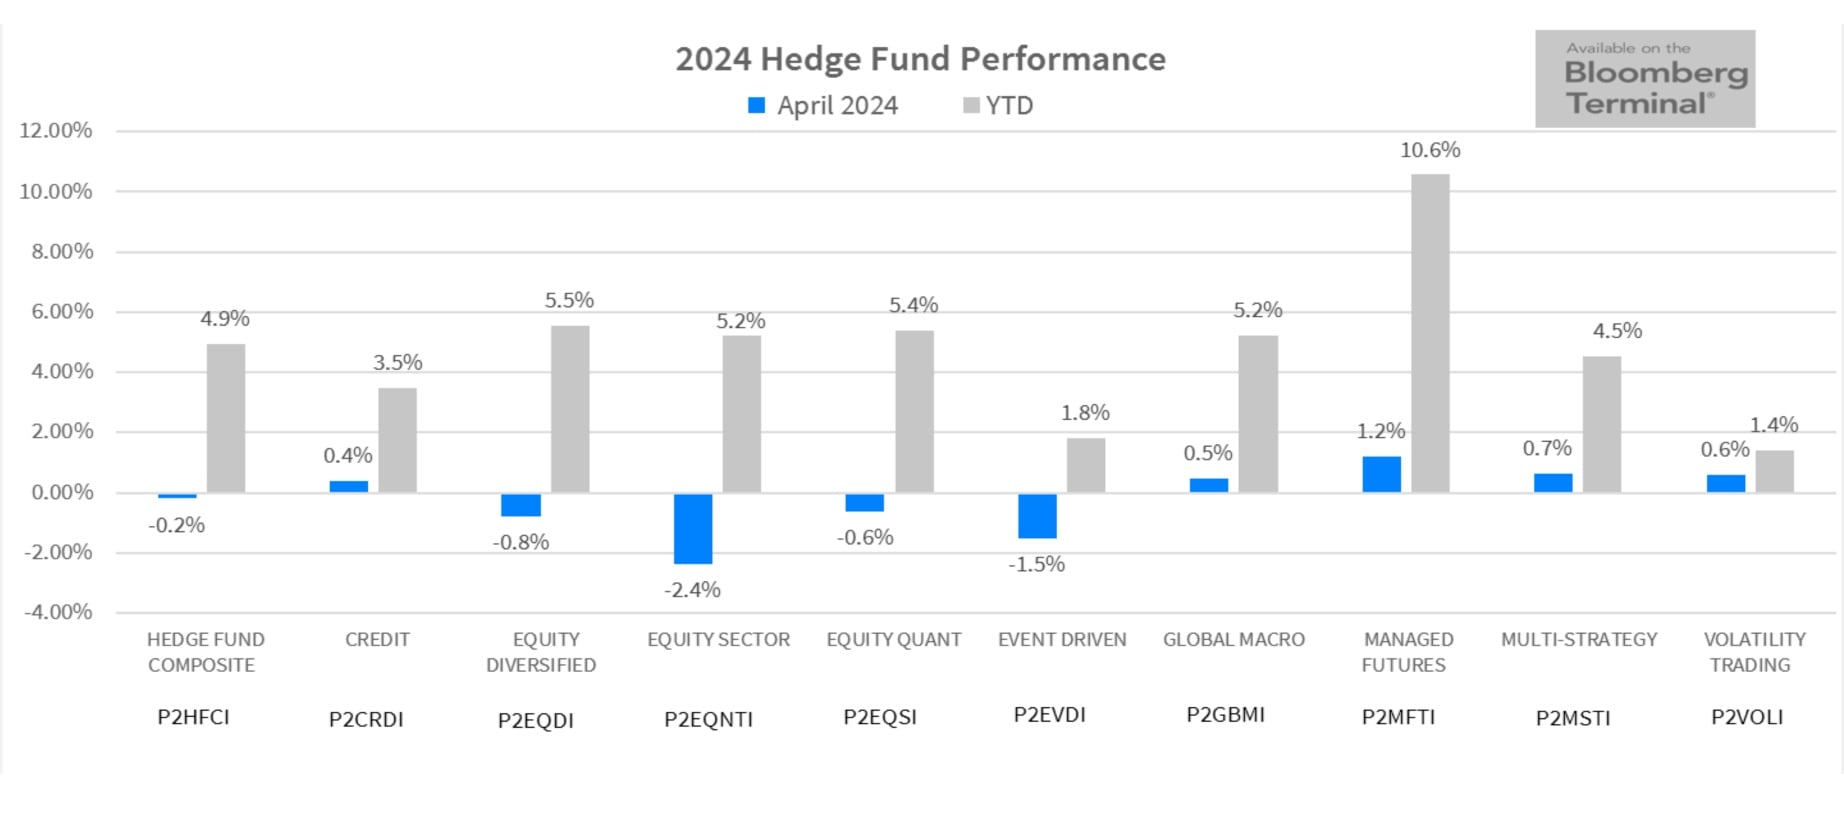
- The PivotalPath Composite Index declined 0.2% in April and is up 4.9% YTD. The Index continues to generate positive alpha of 6.3% relative to the S&P 500 (S&P) over the last 12 months, even as equity markets declined in April.
- PivotalPath Index App launch
- Over the last few months PivotalPath has been urged by its allocator clients to create a shared and common ‘performance language’. As a result, we are making our highly accurate and representative indices available to hedge funds, for free, via a new app https://index.pivotalpath.com/.
- Managed Futures continue their hot start to the year
- Managed Futures posted +1.2% in April and is now +10.6% YTD, leading all major hedge fund indices and its making for its 2nd best start to a year. The return sits in the 90th percentile of all 4-month rolling periods dating back to 2000.
- Multi-Strategy Indices continue to do well, as equity focused strategies decline:
- PivotalPath’s Multi-Strat Index gained 0.7% in April and is +4.5% YTD.
- Our Equity Sector Index declined 2.4% in April, though remains above +5% YTD.
- The year of the high-quality launch continues
- We are tracking 60+ launches hailing from $1bn+ firms, one of best launch environments for high quality funds on record according to multiple prime brokers.
Download this month’s PPOV
To access this month’s PPOV PDF please provide the following information.
For allocators evaluating hedge fund performance, context matters.
Every month, on behalf of over $300B in client hedge fund capital, PivotalPath tracks over 2,500 institutionally-relevant hedge funds, spanning >$3T of industry assets.
Our monthly report contextualizes these data points and identifies trends to help gain unique insight into the hedge fund industry.
2024 Hedge Fund Performance
Strategy Highlights: Is 2024 the year of the stock picker?
- Equity Sector (-2.4% MTD, +5.2% YTD)
- Financials and Health Care declined 3.8% and 4.5% respectively, dragging the Index down in April.
- PivotalPath’s Consumer/Retail Sector was the one bright spot, rising 1.1% in April.
- The Event Driven Index (-1.3% MTD, +2% YTD) has been driven lower by Merger Arb which is now down 0.3% YTD, in the face of significant investor optimism around the strategy coming into 2024.
- The Managed Futures Index generated +1.2% in April (+10.6% YTD). Dispersion came down significantly in April after hitting a multi-year high in March.
Sector Specialists in aggregate continue to become more bullish
The Equity Sector Index exposure to the S&P 500 was 0.51 over the last 12 months, more than double the level from as recently as September of 2023.
Index Exposure is now back to levels last seen in January of 2022, just prior to when inflation caused the equity markets to fall precipitously.
Pivotal Contex
The Backdrop: Stagflation – Slower Growth and Sticky Inflation
- Hedge funds fell modestly in April against declining markets. Economic data continues to drive markets with historically low unemployment and mostly declining inflation. A modest economic slowdown, combined with fears of potential stagflation has spurred doubt around the timing and number of interest rate reductions.
- The Global stock rally came to an abrupt pause in April as all major indices declined in the face of slower than expected growth and continued inflation. The S&P 500, NASDAQ and Russell 2000 declined 4.08%, 4.41% and 7.09% respectively.
- During April, the largest declines were Biotech (XBI) -10.82%, followed by Real Estate (XLRE) -8.45% and Technology(XLK) -5.76%.
- The Crypto asset class reversed earlier gains with Bitcoin and Ethereum declining 15.49% and 18.46% respectively.
- The US 10-year Treasury yield climbed 48bps to 4.68% (as yields move inversely to prices) while the US 2-Year yield increased by 42bps at 5.04%. Both moves indicate the market’s shifting expectations around interest rate reductions in 2024.
- The only sector positive for the month of April was Utilities (XLU) +1.66%.
- Forward looking volatility, as measured by the CBOE Volatility Index (VIX), spiked 20.29% in April ending the month at 15.65 and off recent lows.
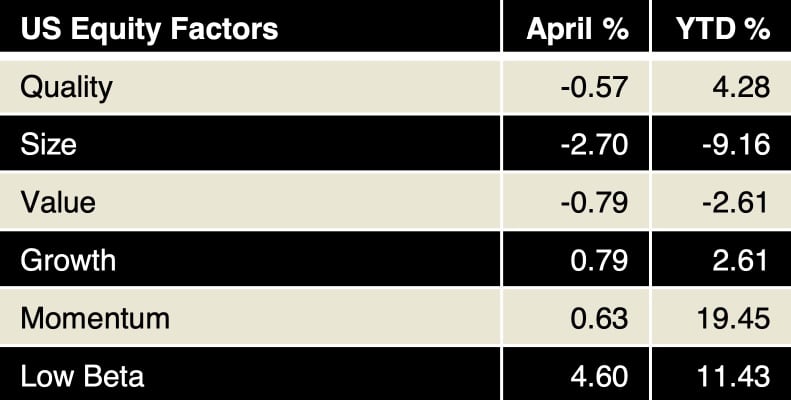
- Value reversed again from +3.98% last month to -0.79% in April, while Growth reversed its March decline of 3.98% to +0.79% in April.
- Momentum, supported by ongoing interest in strongly performing stocks, continued its upward run, finishing April up 0.63%, contributing to a YTD return 19.45%
Alpha Leaderboard
- For the 12-month rolling period through April 2024, Managed Futures, Global Macro and Credit again produced the highest Alpha.
- As expected during steep market declines, most Indices produced increased Alpha.
- The Event Driven Index improved but continues to generate negative Alpha dragged down by Merger Arb.
The chart below depicts alpha generation for each PivotalPath Index, sorted from high to low. Each strategy is color-coded for easy tracking.
Managed Futures continues its reign at the top of the Alpha leaderboard
Managed Futures has had a negative exposure to the S&P since April of 2022, its longest consecutive period of negative exposures since 2003. Over this time, it has annualized 6.3% compared to 6.9% from the S&P. However, with volatility and drawdowns of less than half that of the S&P 500 and an annualized alpha of ~9%, its performance is even more impressive.
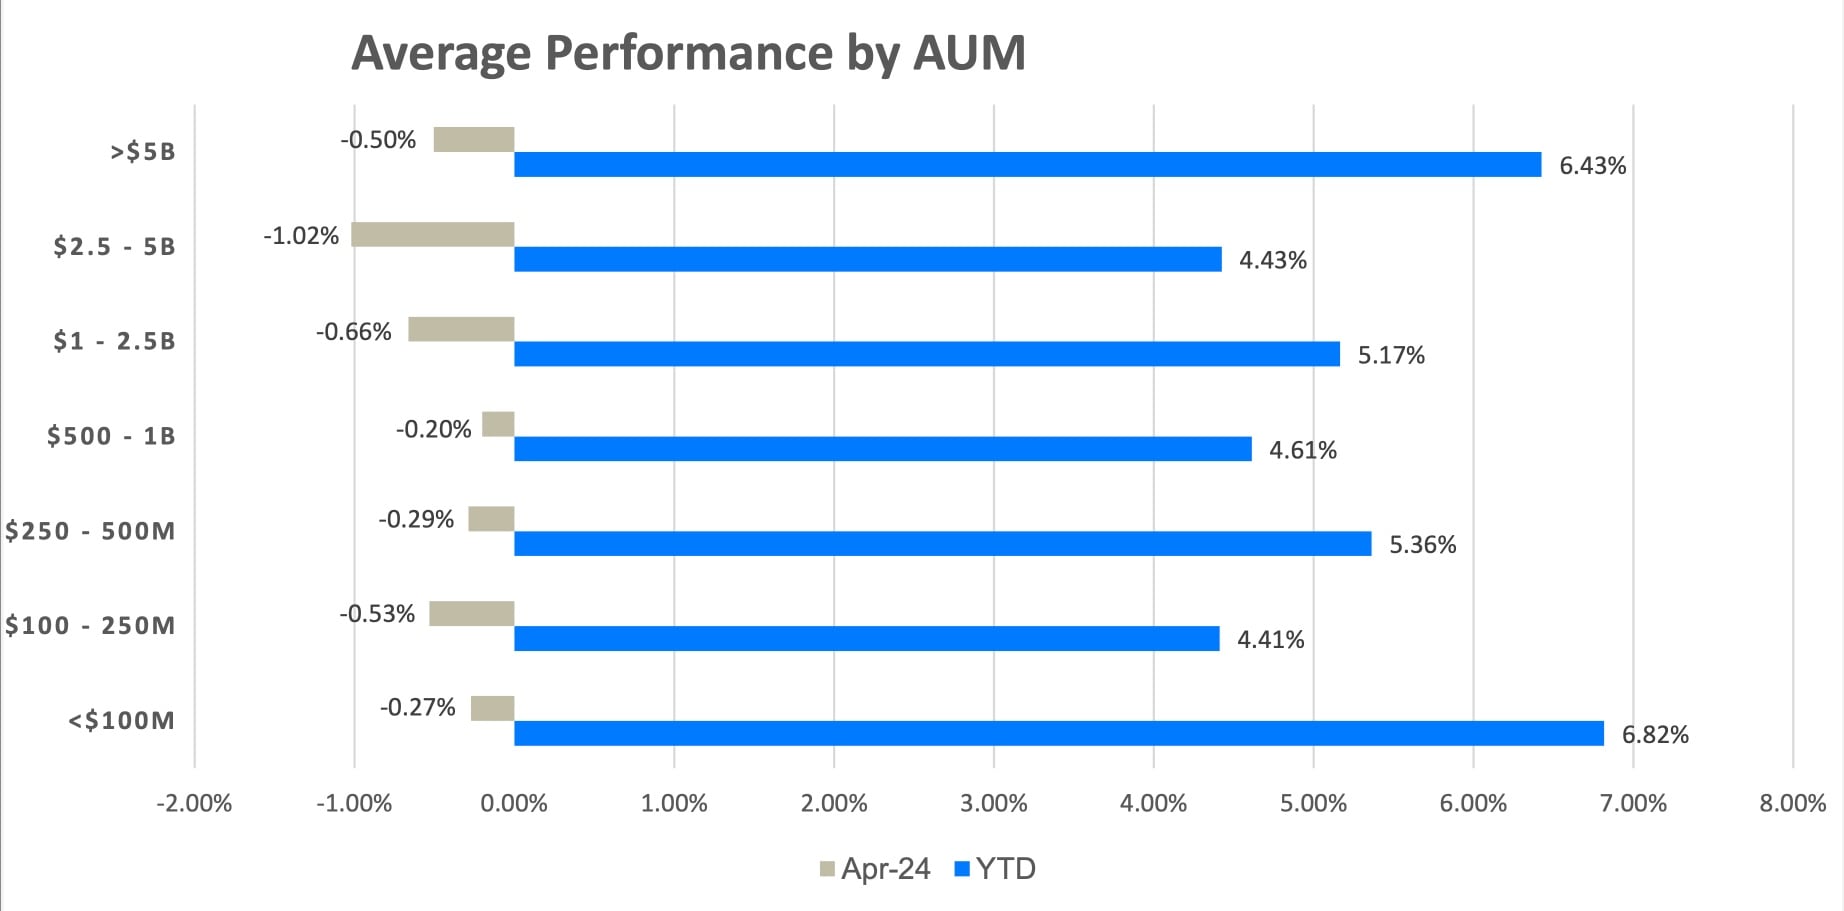
Hedge Fund Performance by AUM
- As illustrated in the graph below, on average, all AUM bands declined modestly in April but remain firmly in positive territory YTD.
- In April, the $2.5B to $5B band declined the most falling 1.02%
- Approximately 50% of all funds reporting were positive in April. The average return of those positive was 2.0%, while the average return of declining funds was -3%