For allocators evaluating hedge fund performance, context matters.
Every month, on behalf of over $300B in client hedge fund capital, PivotalPath tracks over
2,500 institutionally-relevant hedge funds, spanning >$3T of industry assets.
Our monthly report contextualizes these data points and identifies trends to help gain
unique insight into the hedge fund industry.
Key takeaways:
- The PivotalPath Composite Index rose 2.1% in February, building on its January return of 1.1% and 2023’s return of 7.6%. The Index continues to generate positive alpha of 3.4% relative to the S&P 500 (S&P) over the last 12 months even as equity markets soar.
- Managed Futures and Equity Indices win the month:
- Managed Futures continued its recovery and posted +5.1% in February and is now +6.2% YTD as treasuries sold off.
- Equity strategies, including Equity Sector and Equity Diversified Asia Long Short led the way in February coinciding with fierce rallies across Asia followed by the US.
- All major Indices were positive in February except for Volatility Trading.
- Fund Dispersion in February jumped to levels seen in November and December of 2023. The PivotalPath Dispersion Indicator print of 14% in February was higher than the average in 2023 of 12% and 11% historical average between 2008-2022.
- New launches are picking up, especially for PMs coming out of multi-billion dollar hedge funds. Thus far in 2024, over 40 funds of that ilk have either launched or announced they will do so this calendar year, many from large multi-strats. While some of these launches were postponed from Q3/Q4 of 2023 due to a difficult capital raising environment, the trend indicates renewed interest in single strategy funds that until recently would mostly have been swallowed by multi-strats. Click here for an in-depth discussion in a recently published article in Reuters.
Download this month’s PPOV
To access this month’s PPOV PDF please provide the following information.
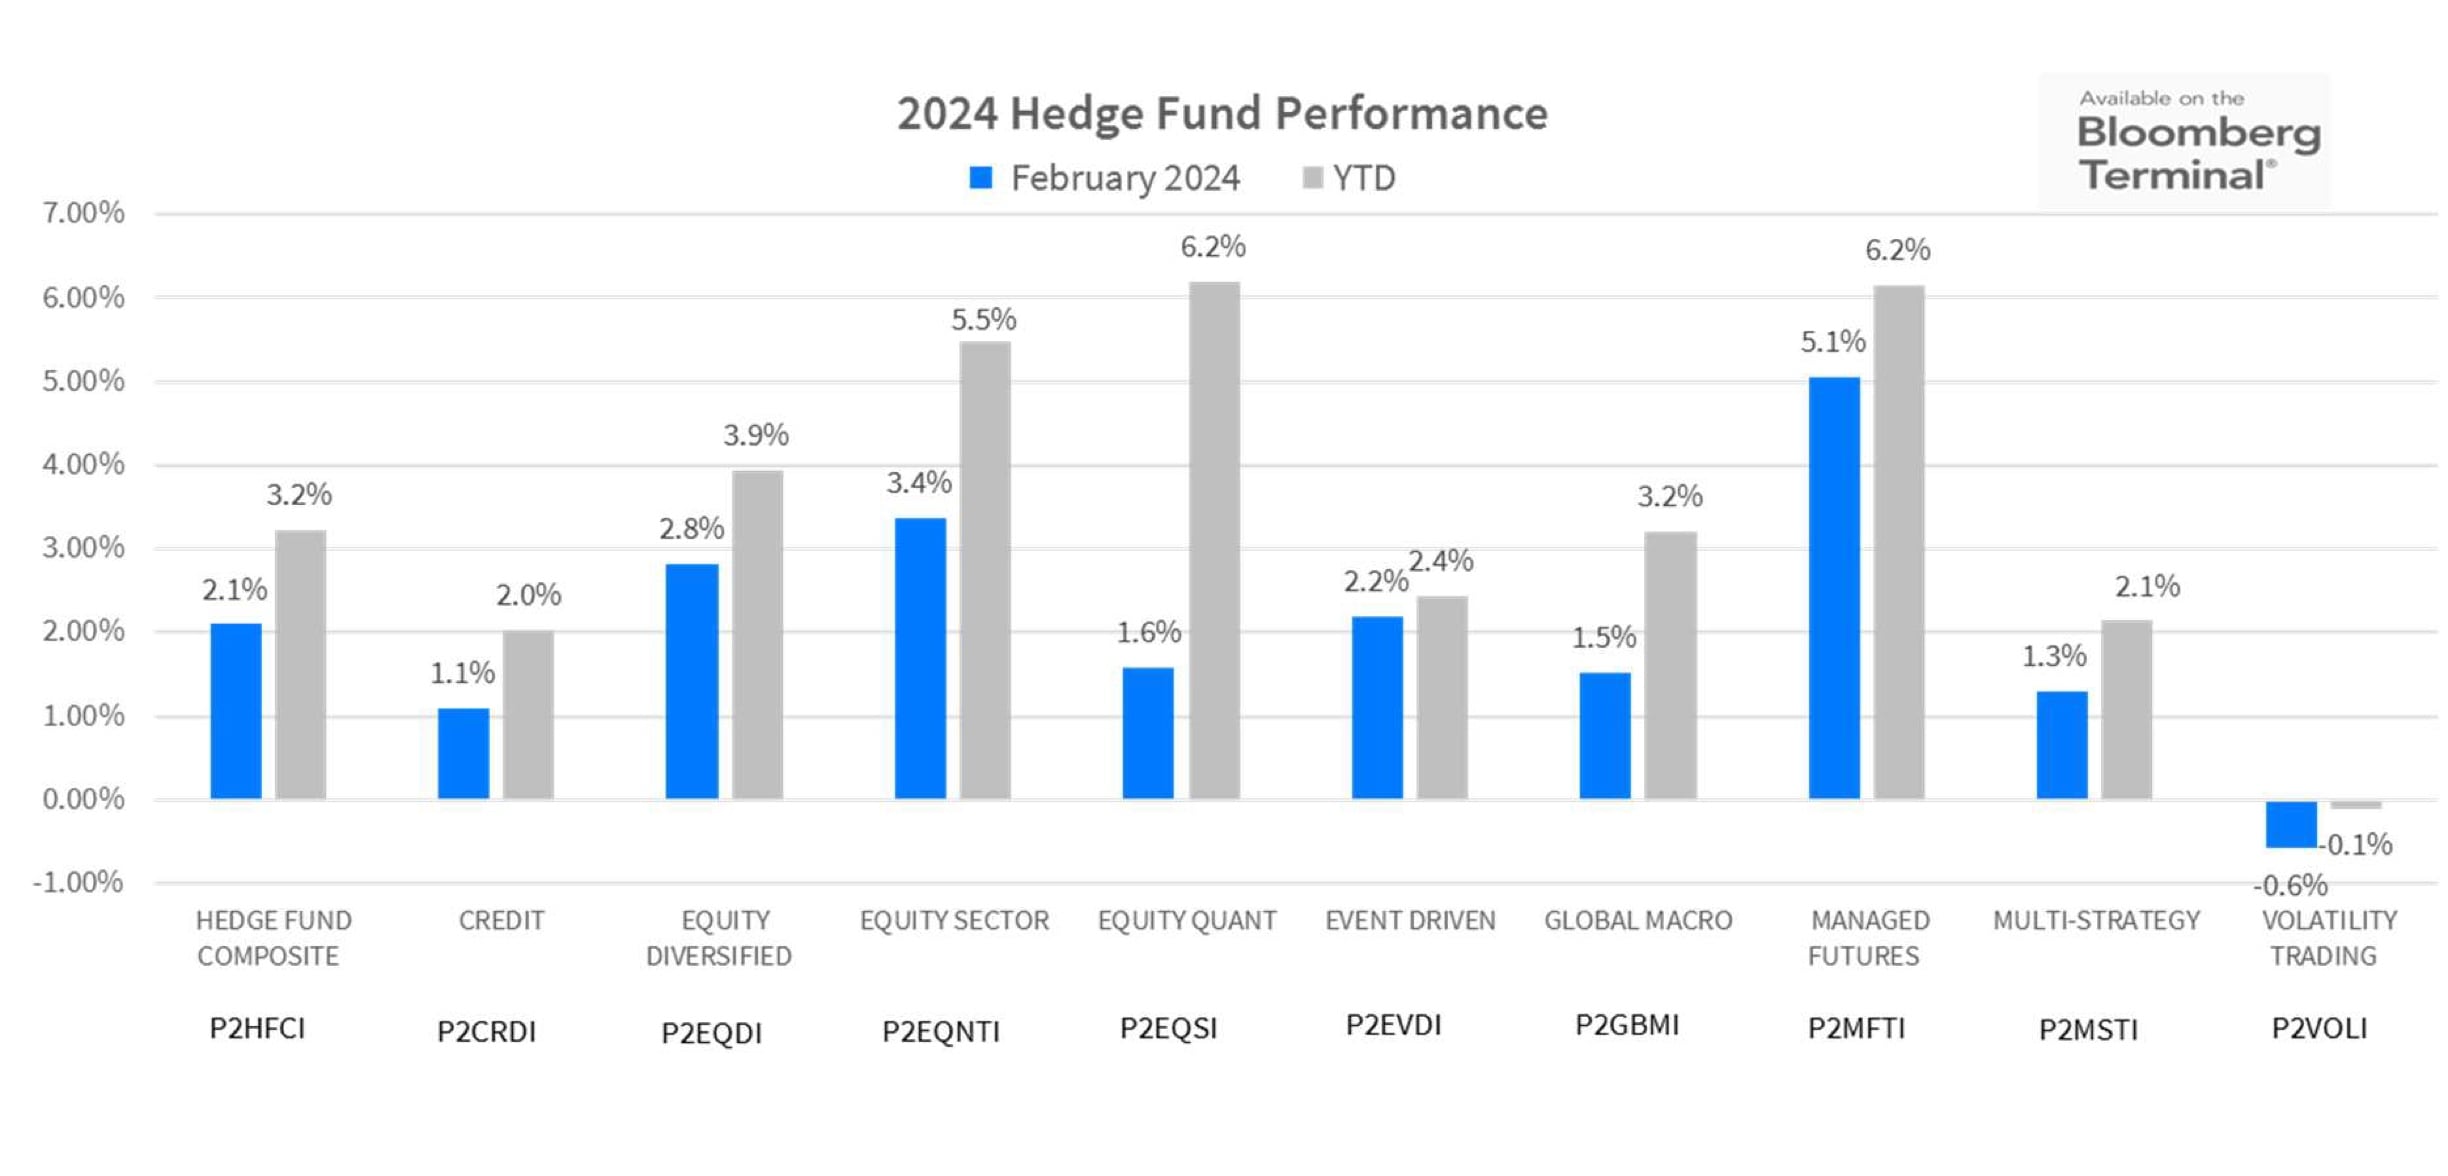
2024 Hedge Fund Performance
Strategy Highlights
- February continued the trend of positive returns for most hedge fund strategies. The PivotalPath Hedge Fund Composite appreciated 2.1% and is +3.2% for the year.
- Equity Indices including Equity Quant (+1.4% MTD, +6.2% YTD) Equity Sector (+3.4% MTD, +5.5% YTD) and Equity Diversified (+2.8% MTD, +3.9% YTD) performed well with strong monthly and YTD returns.
- Within the Equity Sector Index, TMT led the way appreciating 5.5% in February (+7.9% YTD). Healthcare has also done well, +4.4% in February (+8.8% YTD).
- Managed Futures sustained its recovery from a decline in December and 2023, rising 5.1% in February and is now +6.2% in 2024.
Stock picking hedge funds remain more bullish
The Equity Sector Index exposure to the S&P 500 was 0.46 over the last 12 months through January. It remains far above recent lows of 0.25 in September of 2023 and the highest level since February of 2022. This is also consistent with, though less extreme than, Prime Broker reports from JP Morgan and Goldman Sachs in February which cited net and gross leverage near 10-year highs for U.S. equity funds.
Pivotal Context
The Backdrop: Mixed Signals – Employment, Inflation, and Interest Rate Expectations
- Hedge fund performance continued its positive trend with gains in all areas except Volatility Trading. Economic data is driving the markets with historically low unemployment and modestly declining inflation, the latter of which is creating question marks around the timing and number of interest rate reductions.
- Global stocks continued to appreciate with the S&P 500, Nasdaq and DJIA rising 5.34%, 6.12%, and 2.22%, respectively. The broader Russell 2000 also appreciated 5.52%, illustrating broader market participation.
- Crypto currencies stole the show in February with Bitcoin posting a 45% increase nearing all time highs. Ethereum rose 47% during the month.
- The US 10-year Treasury yield increased 34bps to 4.25% (as yields move inversely to prices) while the US 2-Year yield also increased by 41bps to 4.62%. This is a 7bps steepening of the yield curve versus last months modest flattening, reflecting uncertainty in the economy and timing of interest rate reductions.
- The best performing equity sectors in February were Biotech (IBB) +12.57%, and Consumer Discretionary (XLY) 7.89%.
- Forward looking volatility, as measured by the CBOE Volatility Index (VIX), declined 6.6% in February ending the month at 13.40.
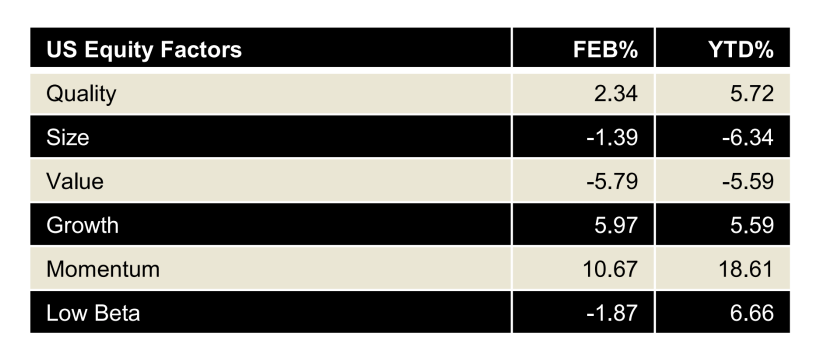
- Momentum continued its torrid pace, gaining 10.7% in February and is now up 18.6% YTD. If the year ended now, its gain would be the most since 2015 and 2008 before that. Factor volatility in general is at historic highs, creating a fertile environment for Global Macro Risk Premia and Equity Quant funds.
Alpha Leaderboard
- For the 12-month rolling period through February 2024, Managed Futures and Credit continued to produce the highest Alpha.
- Investors and managers are increasingly aligned on opportunities in Credit, with 2024 expected to see a period of out performance for opportunistic credit specialists, as well as an increase in allocations to credit funds.
- Event Driven is the only Index that continues to generate negative Alpha.
The chart below depicts alpha generation for each PivotalPath Index, sorted from high to low. Each strategy is color-coded for easy tracking.
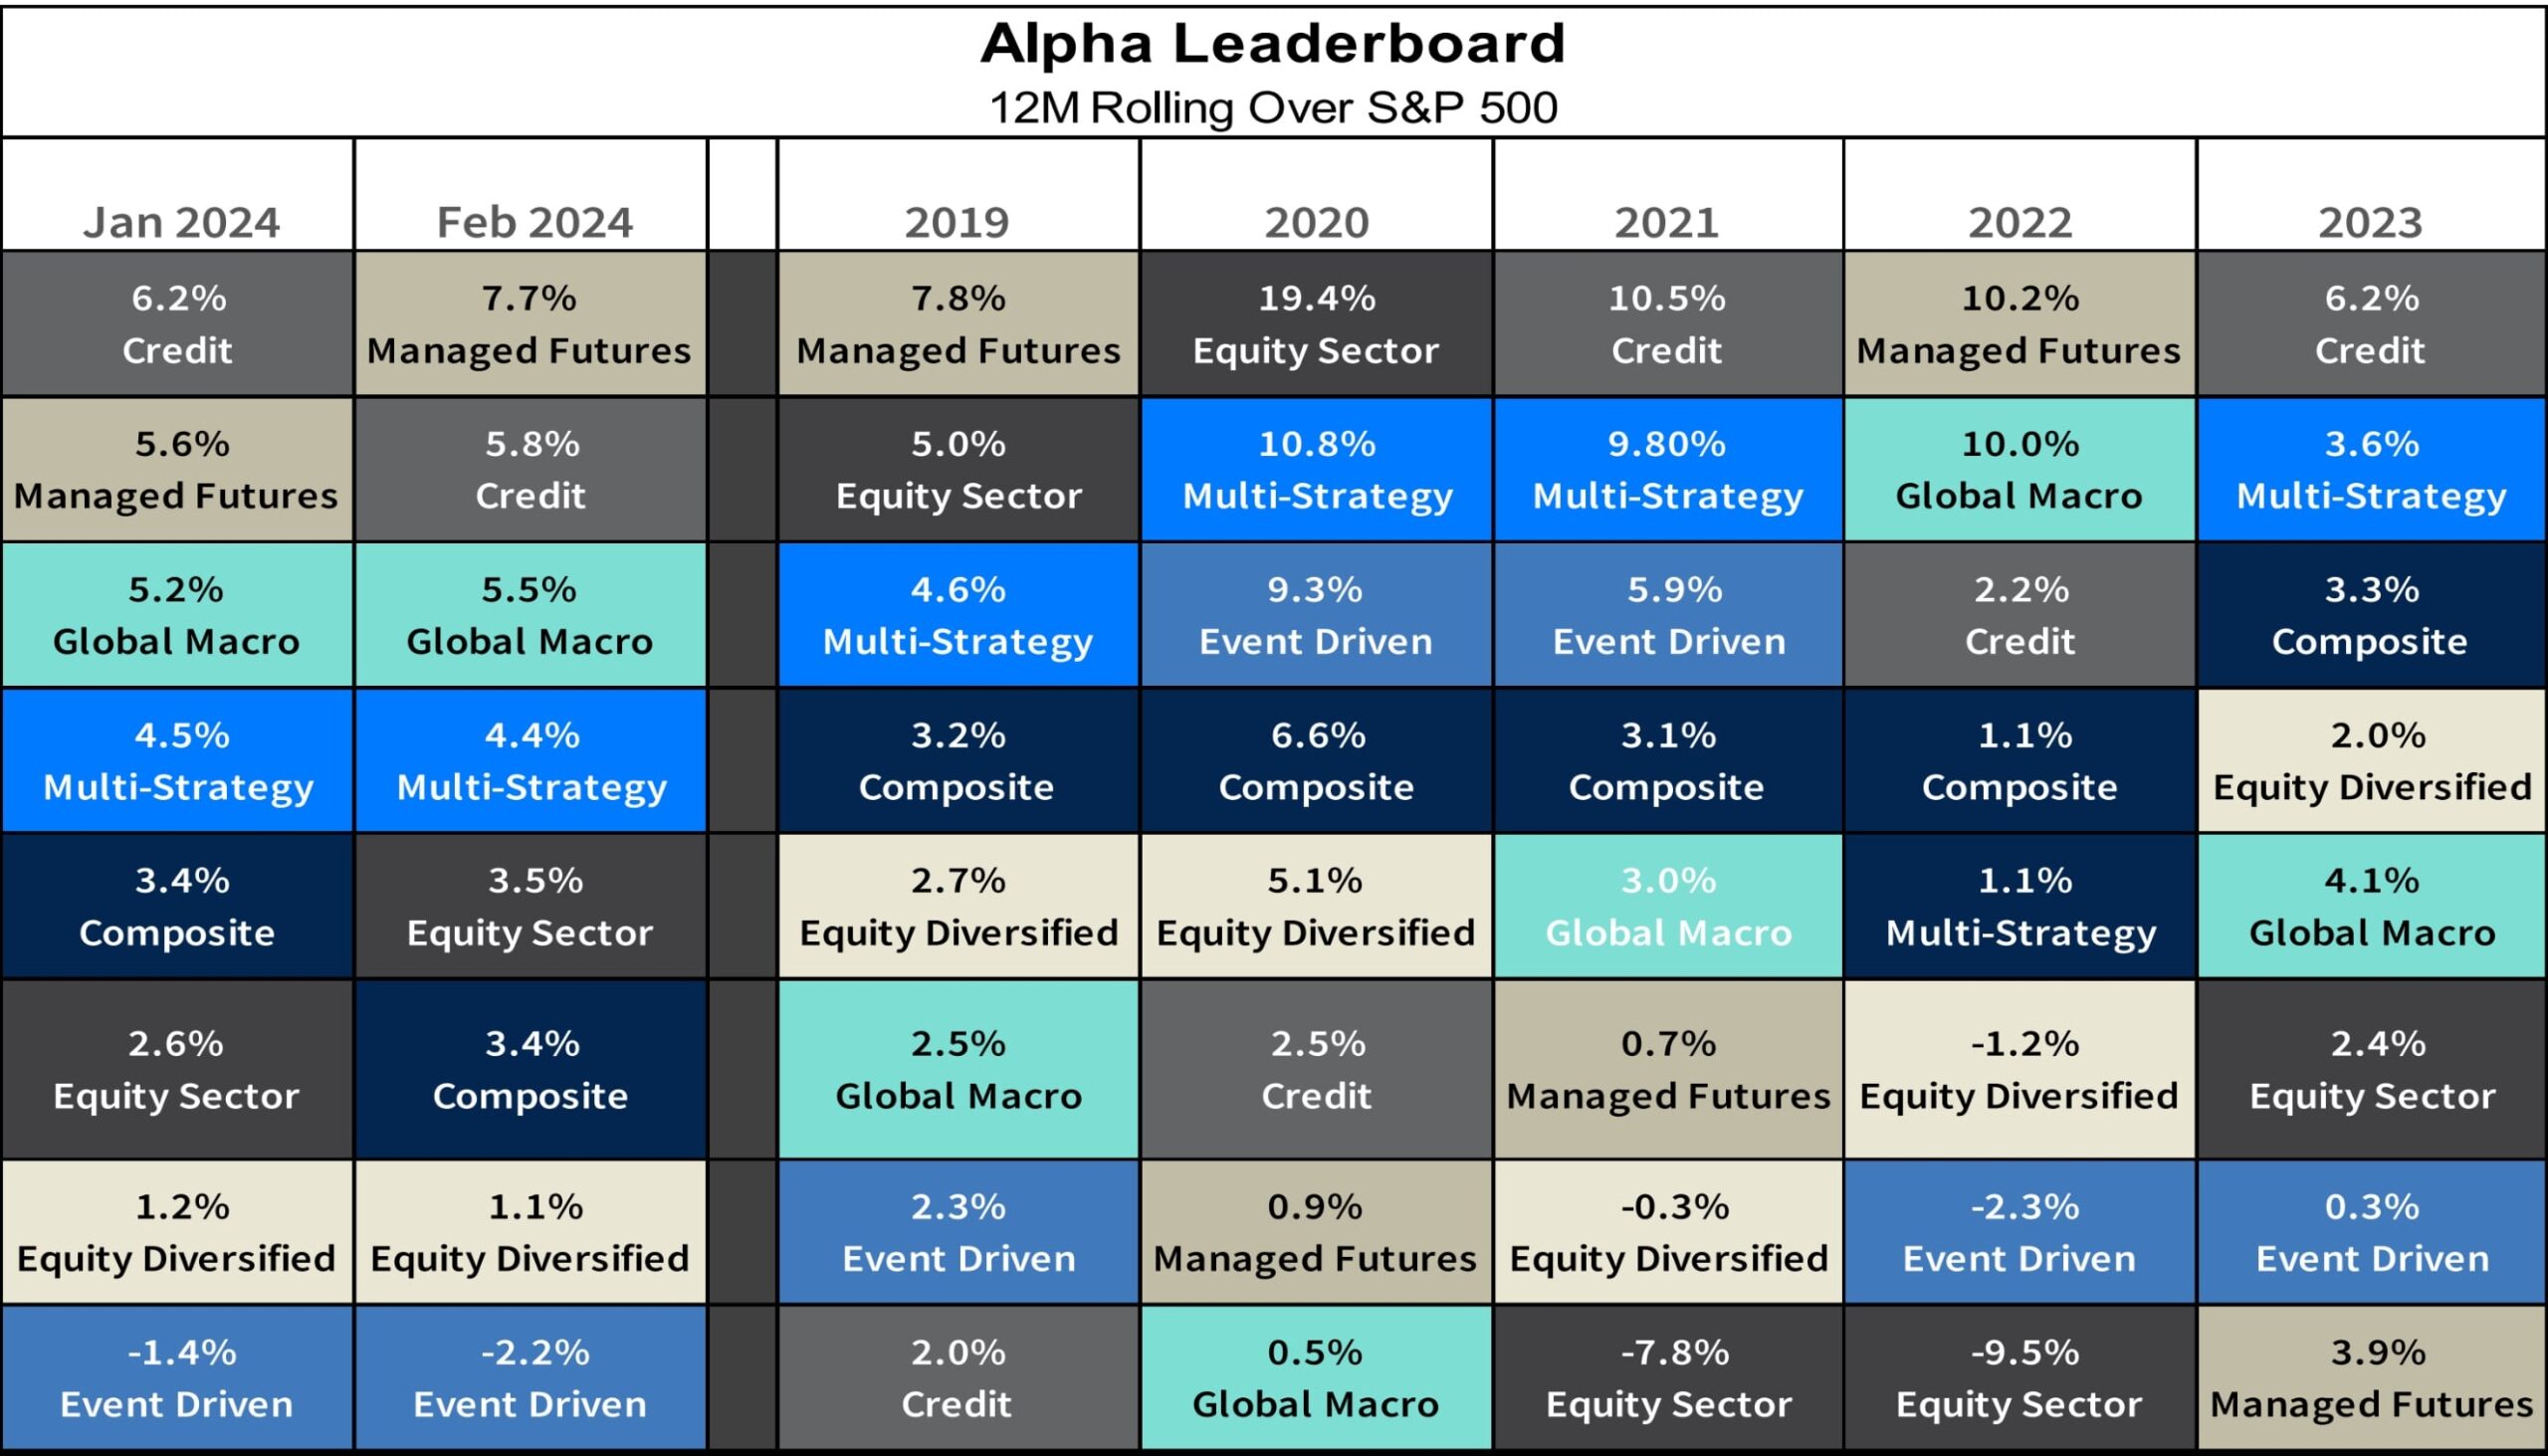
Managed Futures leaps back to the front of the Alpha leaderboard
Throughout 2023, we discussed Managed Futures’ rare and sizable short exposure to Treasury Futures, including a deeper dive here. While off its highs, current exposure remains in meaningful negative territory (since Feb 2021) to a level unseen since 2007. Managed Futures benefited from Treasuries selling off (rates move inversely to prices) significantly in February.
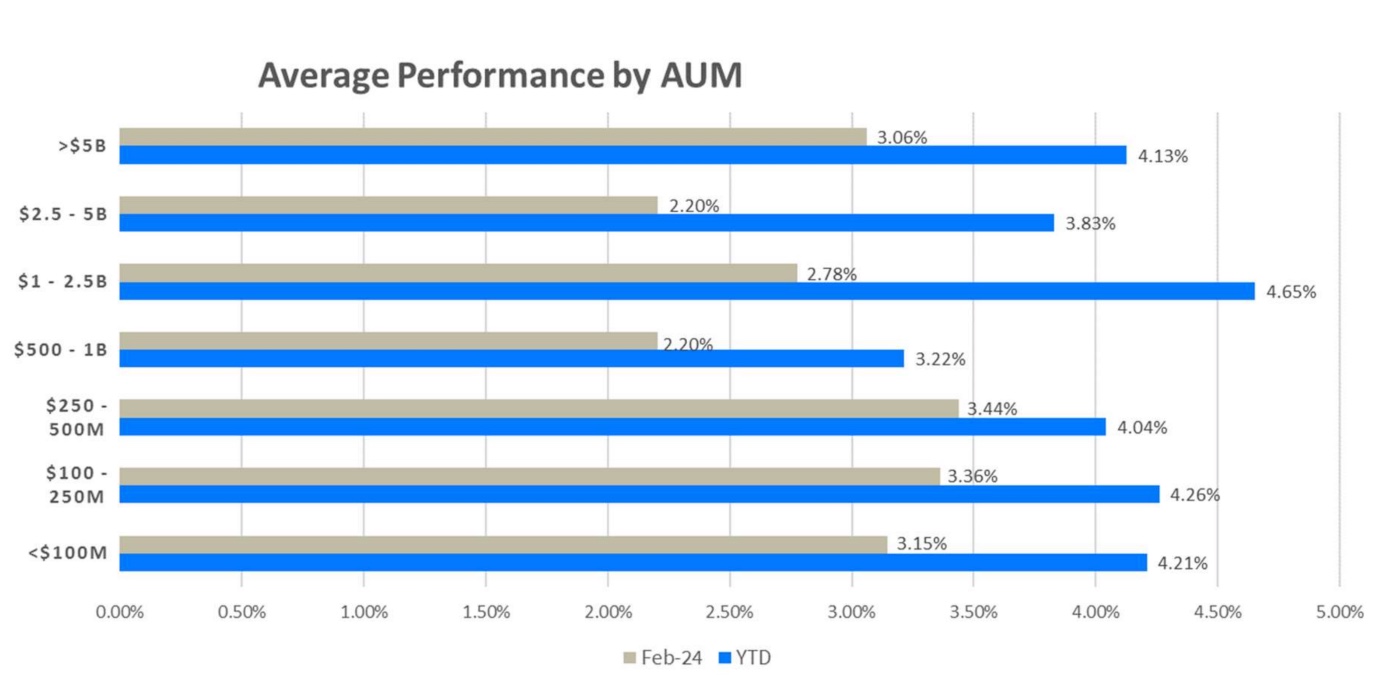
Hedge Fund Performance by AUM
- As illustrated in the graph below, on average, all AUM bands have appreciated during the MTD and YTD.
- YTD, mid-sized institutional class managers (those between $1-$2.5B) outperformed the other AUM bands, with average returns of 4.65%
- Approximately 83% of all funds reporting are positive for the year. The average return of those positive is 3.9% in February and 5.8% YTD. The 17% of declining funds averaged losses of 2.2% in February and 3.6% YTD.