For allocators evaluating hedge fund performance, context matters.
Every month, on behalf of over $300B in client hedge fund capital, PivotalPath tracks over 2,500 institutionally-relevant hedge funds, spanning >$3T of industry assets. Our monthly report contextualizes these data points and identifies trends to help gain unique insight into the hedge fund industry.
Key takeaways:
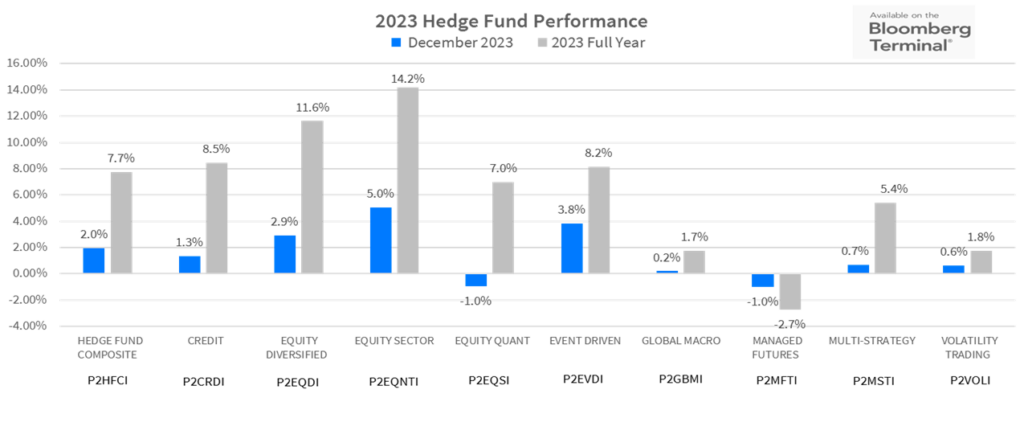
- The PivotalPath Composite Index rose 2.0% in December, bringing the Index to
+7.7% in 2023. The Index continues to generate positive alpha of 3.3% relative to the
S&P 500 (S&P) over the last 12 months. December’s return also helped the Index handily beat the risk-free rate, a recently revived barometer of investor satisfaction. - 2023 Index leaderboard mirror image of 2022:
- Technology/Media/Telecom Sector Index (+17.8%) specifically and Equity Sector Index (+14.1%) more broadly led the way in 2023 after finishing 2022 at the bottom.
- Managed Futures Index (-2.7%) and Global Macro Index (+1.8%) rounded out the worst performers in 2023 after topping the charts in 2022.
- Fund Dispersion back to normal after years of being elevated. The PivotalPath Dispersion Indicator print of 12% was the lowest since 2019, though in line with its historical average between 2008-2022.
- 80% of funds were positive in 2023 and over 90% of PivotalPath Indices.
Download this month’s PPOV
To access this month’s PPOV PDF please provide the following information.
2024 Hedge Fund Performance
Strategy Highlights
- December continued the trend of positive returns for most hedge fund strategies, with equity specialists particularly buoyed by the end of year rally experienced by global equity markets. Accordingly, the Equity Sector Index posted 5% on the month and 14.2% for 2023. Event Driven was up 3.8% and finished the year up 8.2%. Equity Diversified also performed well, gaining 2.9% in December and +11.6% for the year.
- Managed Futures was one of the few decliners, losing 1.1% in December and 5.0% in Q4 as treasuries rallied. In March, and most recently in November, PivotalPath discussed Managed Futures’ historic short exposure to Treasury futures and the potential impact on performance. For a deeper dive click here.
What we’re seeing:
What we’re seeing: What goes down, must come up?
During the five-year period between 2016-2020, our Equity Quant and Global Macro: Risk Premia Indices annualized returns of 1.2% and 0.5% respectively, falling out of favor with many investors.
Equity Quant (+6.6%) and Risk Premia (+7.2%) generated solid returns in 2023 for the 3rd consecutive year, putting them near the top of the return leaderboard since 2021. This performance, with very little correlation to equity markets, is highly coveted by investors.
Pivotal Context
The Backdrop: Inflation and Interest Rate Projections
Hedge fund performance picked up where it left off in November as economic data continued to support declining interest rates and a soft US economic landing in 2024.
Global stocks hit their highest levels since October 2022, with US indices – supported by the robust performance from the ‘Magnificent 7’– leading the way. Strong Q4 returns drove full year 2023 performance for the Nasdaq (+43%), the S&P 500 (+26%) the Russell 2000 (+15%). However, 70% of the stocks in the S&P 500 underperformed the index itself, illustrating not only the thinness of the market’s appreciation, but the inherent difficulty in active stock selection in 2023.
The US 10-year Treasury yield declined another 55 bps to 3.88% (as yields move inversely to prices) while the US 2-Year yield declined 43bps to 4.25%. Both are now at multi-month lows.
The best performing equity sectors in 2023 were Technology (XLK) +55%, Communications (XLC) 51% and Consumer Discretionary (XLY) +38%. Laggards include Utilities (XLU) -10%, Energy -4% and Consumer Staples (XLP) -3%.
Forward looking volatility, as measured by the CBOE Volatility Index (VIX), declined again in December to levels not seen since pre-COVID, ending the month at 12.45, though realized volatility remained high.
As we pointed out in an August note on the Volatility Effect on Hedge funds, the VIX below 20 has boded well for most equity and credit strategies going back to 2000.
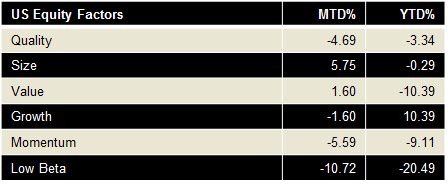
Factor Performance (we use Dow Jones U.S. Thematic Market Neutral factors) as a proxy:
Alpha Leaderboard
- For the 12-month rolling period through December, Credit continued to produce the highest Alpha (+6.2%) followed by Global Macro (+4.1%).
- Managed Futures’ alpha actually rose to +3.9% over the last 12 months, even with negative absolute and relative performance. Given Managed Futures’ negative beta and correlation, any better-than-expected loss produces positive alpha.
The chart below depicts alpha generation for each PivotalPath Index, sorted from high to low.
Each strategy is color-coded for easy tracking.
What we’re seeing:
What we’re seeing: Multi-strat conundrum
There has been a lot of dissatisfaction with Multi-strat in 2023. Conventional wisdom points to weaker performance. Yet, our Multi-Strategy Index generated 5.4% returns in 2023, a Sharpe Ratio of 2.8, along with most (3.6%) returns in the form of alpha relative to the S&P. This is in line with performance between 2018-2022, when they could do no wrong. It’s not the funds that have changed, but investor expectations, especially relative to a meaningful risk-free rate.

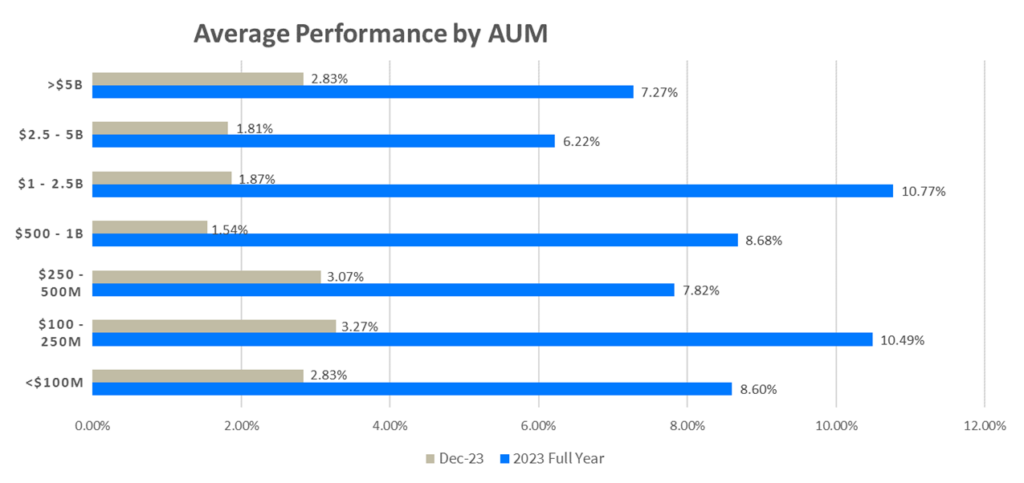
Average Performance by AUM
- As illustrated in the graph below, on average, all AUM bands appreciated again in December.
- The $500MM-$1B band under-performed marginally relative to the other size bands.
- For 2023, all AUM bands were positive with the $1B-$2.5B band continuing to lead the way.
- 76% of funds were positive in December while 80% were positive for the year. The 20% of funds that declined averaged a loss of 8% while the 80% of the positive performers averaged a return of 13%.