For allocators evaluating hedge fund performance, context matters.
Every month, on behalf of over $300B in client hedge fund capital, PivotalPath tracks over 2,500 institutionally-relevant hedge funds, spanning >$3T of industry assets. Our monthly report contextualizes these data points and identifies trends to help gain unique insight into the hedge fund industry.
Key takeaways:
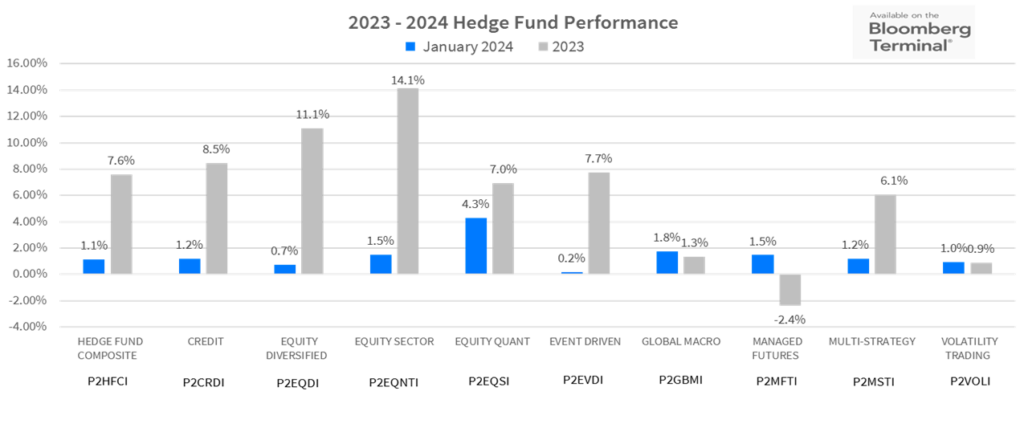
- The PivotalPath Composite Index rose 1.1% in January, building on the 2023 return of 7.6%. The Index continues to generate positive alpha of 3.4% relative to the S&P 500 (S&P) over the last 12 months.
- Quantitative Indices win the month:
- Equity Quant (+4.3%) led the way in January and was closely followed by Global Macro: Risk Premia (+3.9%).
- Managed Futures (+1.5%) and Global Macro (+1.8%) also generated positive returns after struggling in 2023 and December specifically.
- Fund Dispersion in January was consistent with Dispersion levels for all of 2023. The PivotalPath Dispersion Indicator print of 12% in January was the same as the 2023 average which was the lowest calendar year Dispersion since 2019, though in line with its historical average between 2008-2022.
Download this month’s PPOV
To access this month’s PPOV PDF please provide the following information.
2024 Hedge Fund Performance
Strategy Highlights
- January continued the trend of positive returns for most hedge fund strategies, with quant strategies in general and the Equity Quant Index in particular outperforming all other indices. Global Macro: Risk Premia also performed well.
- Though vastly different approaches, the correlation between these indices is 0.75 over the last 12 months or the highest level since Q1 of 2020, and in the 92 percentile of rolling 12-month periods since 2008
- Managed Futures recovered after a decline in December and full year 2023, rising 1.5% in January.
- The Equity Sector Index also continued to do well rising 1.5% in January after topping the leaderboard in 2023 as U.S. equities continued their general rise.
What we’re seeing:
Are stock picking hedge funds finally becoming more bullish?
The Equity Sector Index exposure to the S&P 500 was 0.43 over the last 12 months through January. This is well off recent lows of 0.25 in September of 2023 and the highest level since February of 2022. This implies that managers, on average, are the most optimistic regarding equity markets since before inflation became a major market concern.
Pivotal Context
The Backdrop: Inflation and Interest Rate Expectations
- Hedge fund performance picked up where it left off in the fourth quarter as economic data continued to support interest rate reductions in 2024. The question of timing (higher for longer) is now driving markets and volatility.
- Global stocks, while taking a hit late in the month, continued to appreciate with the S&P 500, Nasdaq and DJIA rising 1.68%, 1.02%, and 1.22%, respectively. The broader Russell 2000 declined 3.93% illustrating the continued concentration of a few select stocks driving the markets.
- The US 10-year Treasury yield increased 3bps to 3.91% (as yields move inversely to prices) while the US 2-Year yield declined 4bps to 4.21%. This modest flattening of the yield may illustrate the lower probability of recession.
- The best performing equity sectors in January were Communications (XLC) +4.43%, and Financials (XLF) 3.09%. Laggards include Real Estate (XLRE) -4.82%, and Consumer Discretionary (XLY) -4.41%.
- Forward looking volatility, as measured by the CBOE Volatility Index (VIX), rose in January ending the month at 14.35.
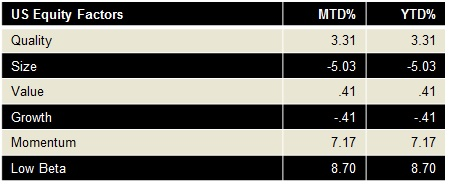
Factor Performance (we use Dow Jones U.S. Thematic Market Neutral factors) as a proxy:
- Low Beta (+8.7%) and Momentum (+7.17%) factors roared back after falling 20.5% and 9.1% in 2023, while Size (-5.03%) fell (as demonstrated by the Russell 2000’s underperformance relative to larger cap indices) after finishing roughly flat in 2023.
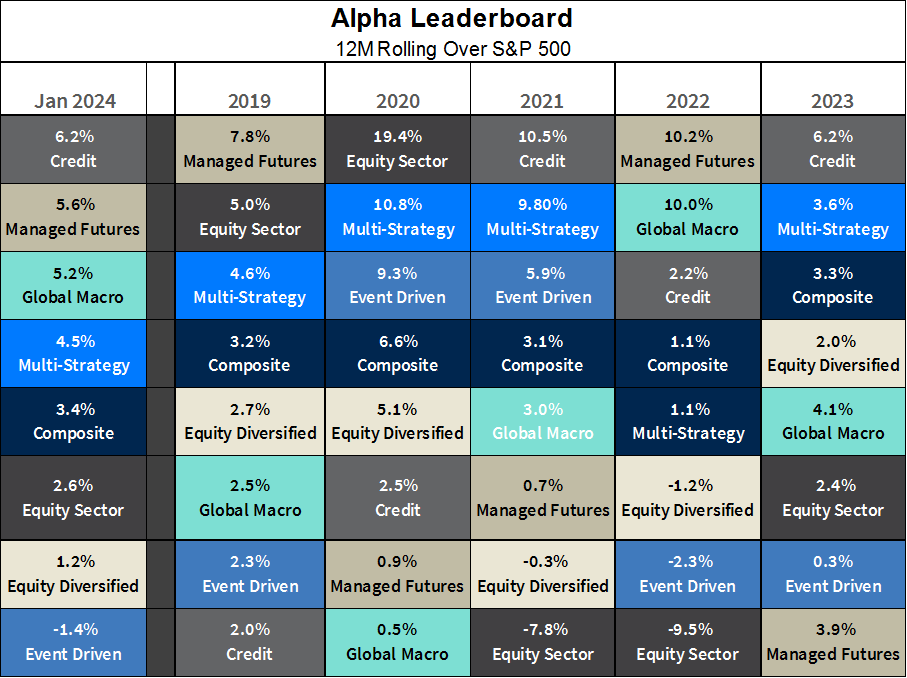
Alpha Leaderboard
- For the 12-month rolling period through January 2024, Credit continued to produce the highest Alpha (+6.2%).
- Managed Futures’ alpha rose significantly to 5.6% while Event Driven fell into negative alpha territory.
The chart below depicts alpha generation for each PivotalPath Index, sorted from high to low.
Each strategy is color-coded for easy tracking.
What we’re seeing:
What we’re seeing: Continued Credit interest aside from Distressed
- Credit in general, has garnered client attention, particularly liquid and opportunistic long/short credit that can trade across the capital structure and jump between instruments. Interest in pure distressed funds remains, although allocations are frozen as default rates remain low within a resilient economy.
- In addition, historically, higher interest rates bode well for returns across all Credit Strategies. The biggest benefactor? Convertible Bond Arbitrage which generated 10% greater returns per annum when rates were above 3% compared to when they were below 3% (between 2000 and 2022).
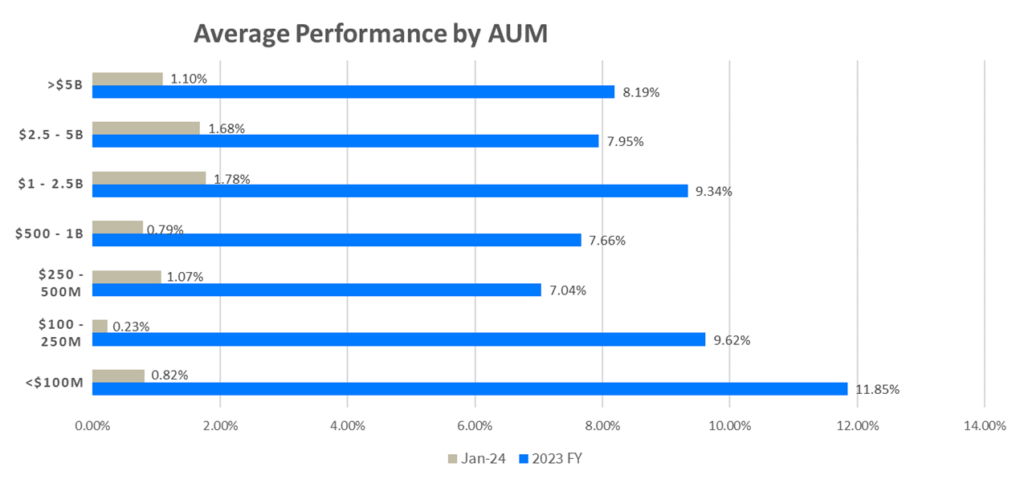
Average Performance by AUM
- As illustrated in the graph below, on average, all AUM bands appreciated in January extending the trend to three months.
- In 2023, smaller funds (those under $100M) outperformed the other bands followed by the $1B-$2.5B band.
- 72% of funds were positive in January, while 80% were positive in 2023.