For allocators evaluating hedge fund performance, context matters.
Every month, on behalf of over $300B in client hedge fund capital, PivotalPath tracks over 2,500 institutionally-relevant hedge funds, spanning >$3T of industry assets. Our monthly report contextualizes these data points and identifies trends to help gain unique insight into the hedge fund industry.
Key takeaways:
- The PivotalPath Composite Index rose 2.0% in November, bringing the Index to
+5.8% YTD. The Index continues to generate positive alpha of 3.9% relative to the
S&P 500 (S&P) over the last 12 months. - Why didn’t U.S. equity long short managers keep pace with the S&P in November? 1. They aren’t designed to and 2. They performed better than expected. (see bottom of page 2)
- Dispersion is good as long as it’s positive. PivotalPath’s Hedge Fund Dispersion Indicator jumped to 4.5 in November after hovering around its long-term average of 3.1 for most of 2023. Almost all of the dispersion came from equity volatility on the upside.
- Managed Futures and Global Macro were among the few strategies suffering losses while treasuries and equities rallied.
Download this month’s PPOV
To access this month’s PPOV PDF please provide the following information.
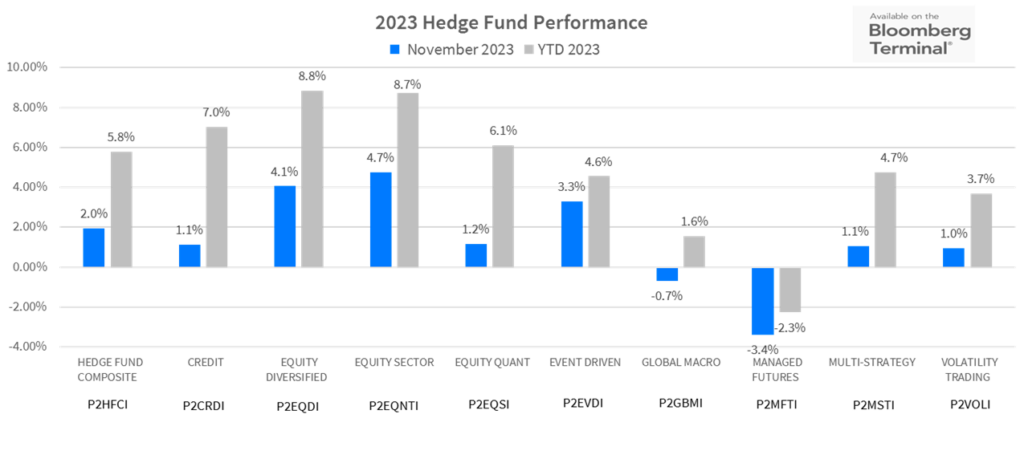
2023 Hedge Fund Performance
Strategy Highlights
- Reversing a broadly challenging October, almost all indices were positive for the month. Managed Futures and Global Macro were the two exceptions. Recall that we had discussed Managed Futures’ sizable short exposure to Treasury Futures in our last two PPOVs and conducted a deeper dive here.
- An almost mirror image in leaders and laggers compared to 2022, in 2023, most major Indices are positive with Equity Diversified (+8.8%), Equity Sector (+8.7%) and Credit (+7.0%) Indices leading the way. Managed Futures, the star performer of 2022, is the only Index in negative territory in 2023.
What we’re seeing:
*Better than expected? An OLS regression (using the last 18 months of data through October with a strong linear fit) of the US Equity Long/Short Fundamental Index against the S&P would have yielded a gain of 3.8%. The Index returned 4.3%. They have also produced significantly better than expected gains YTD due to higher alpha generation.
Pivotal Context
The Backdrop: Interest Rates and the Economy
- Hedge fund performance jumped in November as economic data showed a long-awaited decline in inflation, resulting in falling bond yields, and surging equity markets.
- The market reaction to the positive data and news drove largest rebound since 2020 with the S&P up 9.1%, the Nasdaq +10.7%, the DJIA +8.8%, and the Russell 2000 +8.9%. November’s strong performance brought all major equity indices into positive territory for 2023. The S&P is now up 20.8% while the economic bellwether Russell 2000 is up 2.7%.
- The US 10-year Treasury yield declined 60 bps to 4.33% (as yields move inversely to prices) while the US 2-Year yield declined 39bps to 4.68%.
- The new economic optimism around a soft-landing drove broad sector appreciation. Interest rate sensitive sectors led the way with Biotech (XBI) rising 14%, Technology (XLK) +12.9%, Consumer Discretionary (XLY) +11%. Energy (XLE) declined slightly due to lower oil prices, -0.7%.
- Forward looking volatility, as measured by the CBOE Volatility Index (VIX), fell to levels not seen since pre-COVID, though realized volatility remained high as global equity markets generated significant returns.
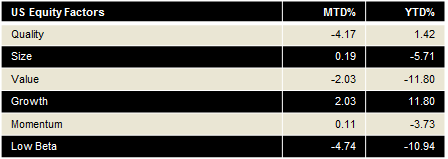
Factor Performance (we use Dow Jones U.S. Thematic Market Neutral factors) as a proxy:
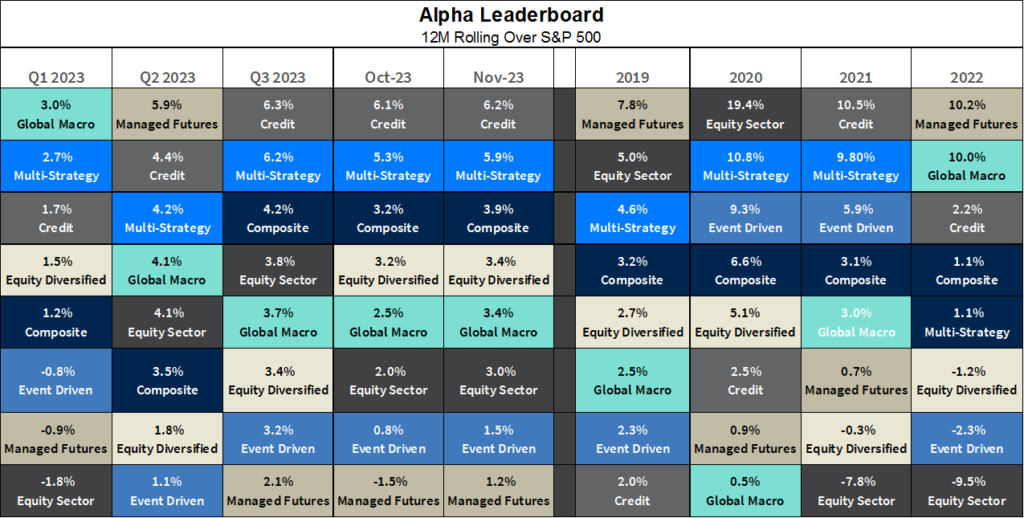
Alpha Leaderboard
- For the 12-month rolling period through November, Credit continues to produce the highest Alpha (+6.2%) followed once again by Multi-Strategy (+5.9%).
- Managed Futures produced the lowest alpha but shifted back into positive territory.
The chart below depicts alpha generation for each PivotalPath Index, sorted from high to low.
Each strategy is color-coded for easy tracking.
What we’re seeing:
Client interest in Credit strategies continues to increase with Distressed remaining the most popular. And with good reason. Our Credit Distressed Index generated >300bps of annualized returns when the risk-free rate was above 3% compared to when it was below. As rates remain elevated, this could bode well for the strategy.
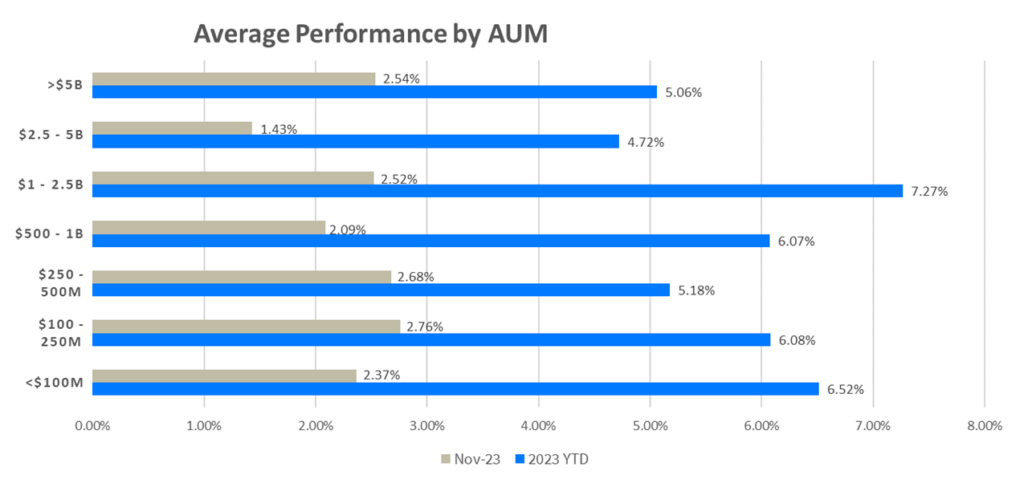
Average Performance by AUM
- As illustrated in the graph below, on average, all AUM bands appreciated in November.
- The $2.5B-$5B band under-performed marginally relative to the other size bands.
- YTD, all AUM bands are positive with the $1B-$2.5B and <$100M bands continuing to lead the way.
- 75% of funds are positive for both the month of November and YTD.