For allocators evaluating hedge fund performance, context matters.
Every month, on behalf of over $300B in client hedge fund capital, PivotalPath tracks over
2,500 institutionally-relevant hedge funds, spanning >$3T of industry assets.
Our monthly report contextualizes these data points and identifies trends to help gain
unique insight into the hedge fund industry.
Key takeaways:
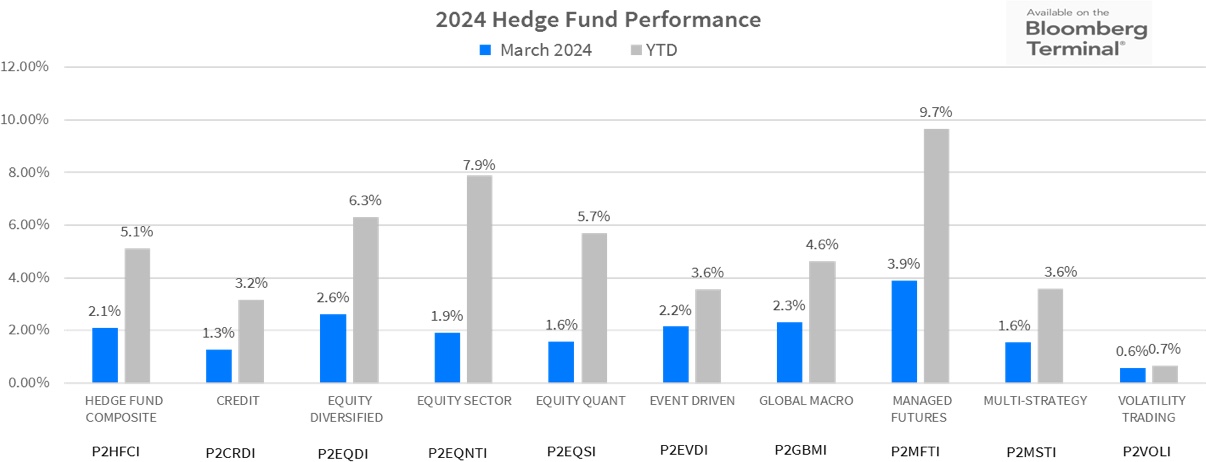
- The PivotalPath Composite Index rose 2.1% in March and is up 5.1% through Q1. The Index continues to generate positive alpha of 5.6% relative to the S&P 500 (S&P) over the last 12 months, even as equity markets soar.
- Managed Futures and Equity Indices continue to well:
- Managed Futures continued its recovery, posting +3.9% in March and is now +9.7% YTD to lead all major hedge fund indices.
- PivotalPath’s Equity Sector Index gained 1.9% in March and its return of +7.9% YTD comes in 2nd to Managed Futures as equities have rallied across around the globe.
- Equity Quant and Global Macro: Risk Premia continued to generate positive performance in March, +1.6% (+5.7% YTD) and +4.0% (+8.8% YTD) respectively.
- Over the last 3-year-rolling period, their annualized returns of 10.4% and 9.6% rank 2nd and 3rd of all 40+ indices with very little correlation to the S&P.
- Where has correlation been increasing? Only to each other. Their 0.72 correlation over the last 12 months sits at the 90th percentile of values since 2008.
Download this month’s PPOV
To access this month’s PPOV PDF please provide the following information.
2024 Hedge Fund Performance
Strategy Highlights: Is 2024 the year of the stock picker?
- Equity Sector (+1.9% MTD, +7.9% YTD)
- Within Equity Sector, Energy/Utilities/Industrials and Financials appreciated 4.5% and 4.4% respectively in March.
- PivotalPath’s Healthcare Index returned 2.8% in March and at +11.3% sits atop the leaderboard as the best performing sub-Index across all strategies.
- Equity Diversified (+2.6% MTD, +6.3% YTD) performed well alongside broad equity rallies.
- The Managed Futures Index generated 3.9% in March (+9.7% YTD) following a challenging 2023. However, some historically outsized returns in March from a small number of constituents benefited the index disproportionately.
TMT managers have gotten more bullish but remain below January 2022 levels
As communicated to Bloomberg, here The Equity Sector Technology/Media/Telecom Index exposure to the Nasdaq was 0.48 over the last 12 months through March, 37% above recent levels in September of 2023.
However, exposure is still 25% below levels from January of 2022 just prior to when inflation caused the equity markets to fall precipitously.
Pivotal Context
The Backdrop: Mixed Signals – Employment, Inflation, and Interest Rate Expectations
- Hedge fund performance continued its positive trend with gains across all Indices. Economic data is driving the markets with historically low unemployment and modestly declining inflation, the latter of which is creating question marks around the timing and number of interest rate reductions.
- Global stocks continued to appreciate with the S&P 500, Nasdaq and DJIA rising 3.22%, 1.79%, and 2.08%, respectively. The broader Russell 2000 also rose 3.39%, illustrating continued broader market participation.
- Crypto continued to rise with Bitcoin climbing 15%. Bitcoin and Ethereum have gained 67% and 59%, respectively through the first quarter of 2024.
- The US 10-year Treasury yield declined 5bps to 4.20% (as yields move inversely to prices) while the US 2-Year yield held steady at 4.62%. This represents a 5bps increase in the inverted yield curve reflecting uncertainty in the economy and over the timing of interest rate reductions.
- The best performing equity sectors in March were Energy (XLE) +9.60%, Materials (XLB) +6.09% and Utilities (XLU) +5.72%.
- Forward looking volatility, as measured by the CBOE Volatility Index (VIX), declined 2.9% in March ending the month at 13.01.
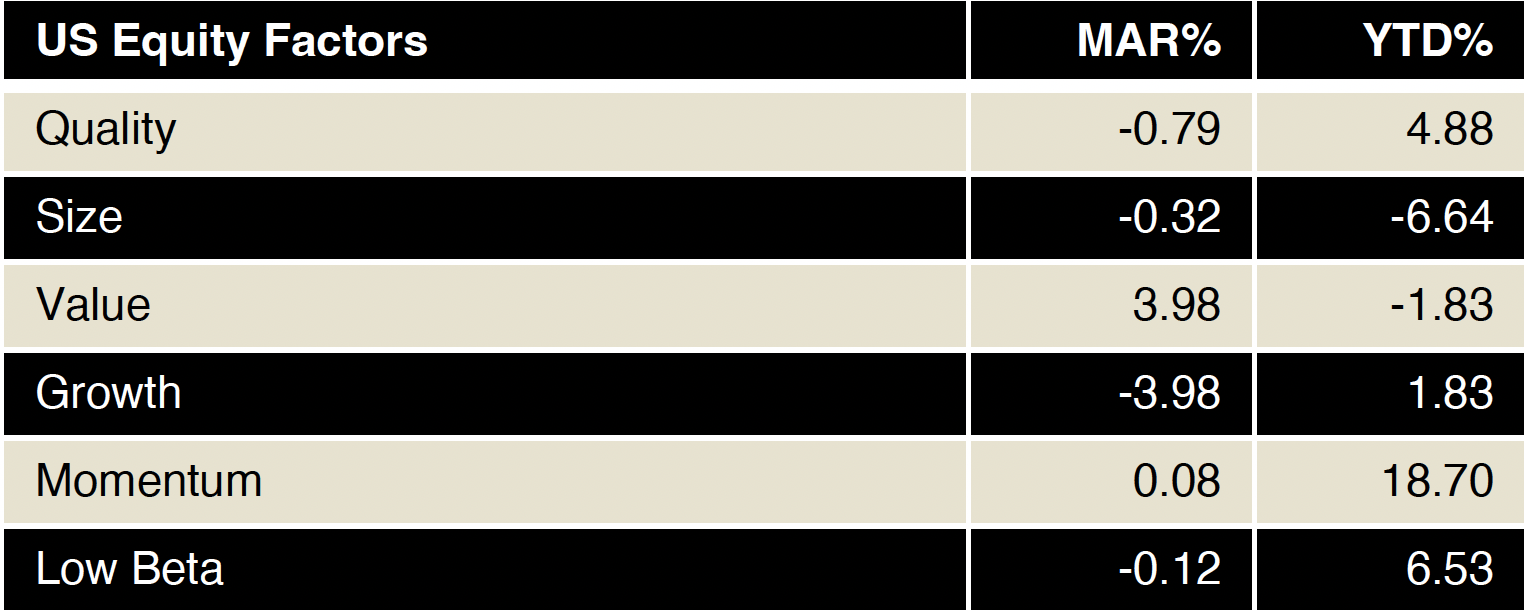
- Value reversed from -5.79% last month to +3.98 in March, while Growth reversed its strong YTD performance declining 3.98%.
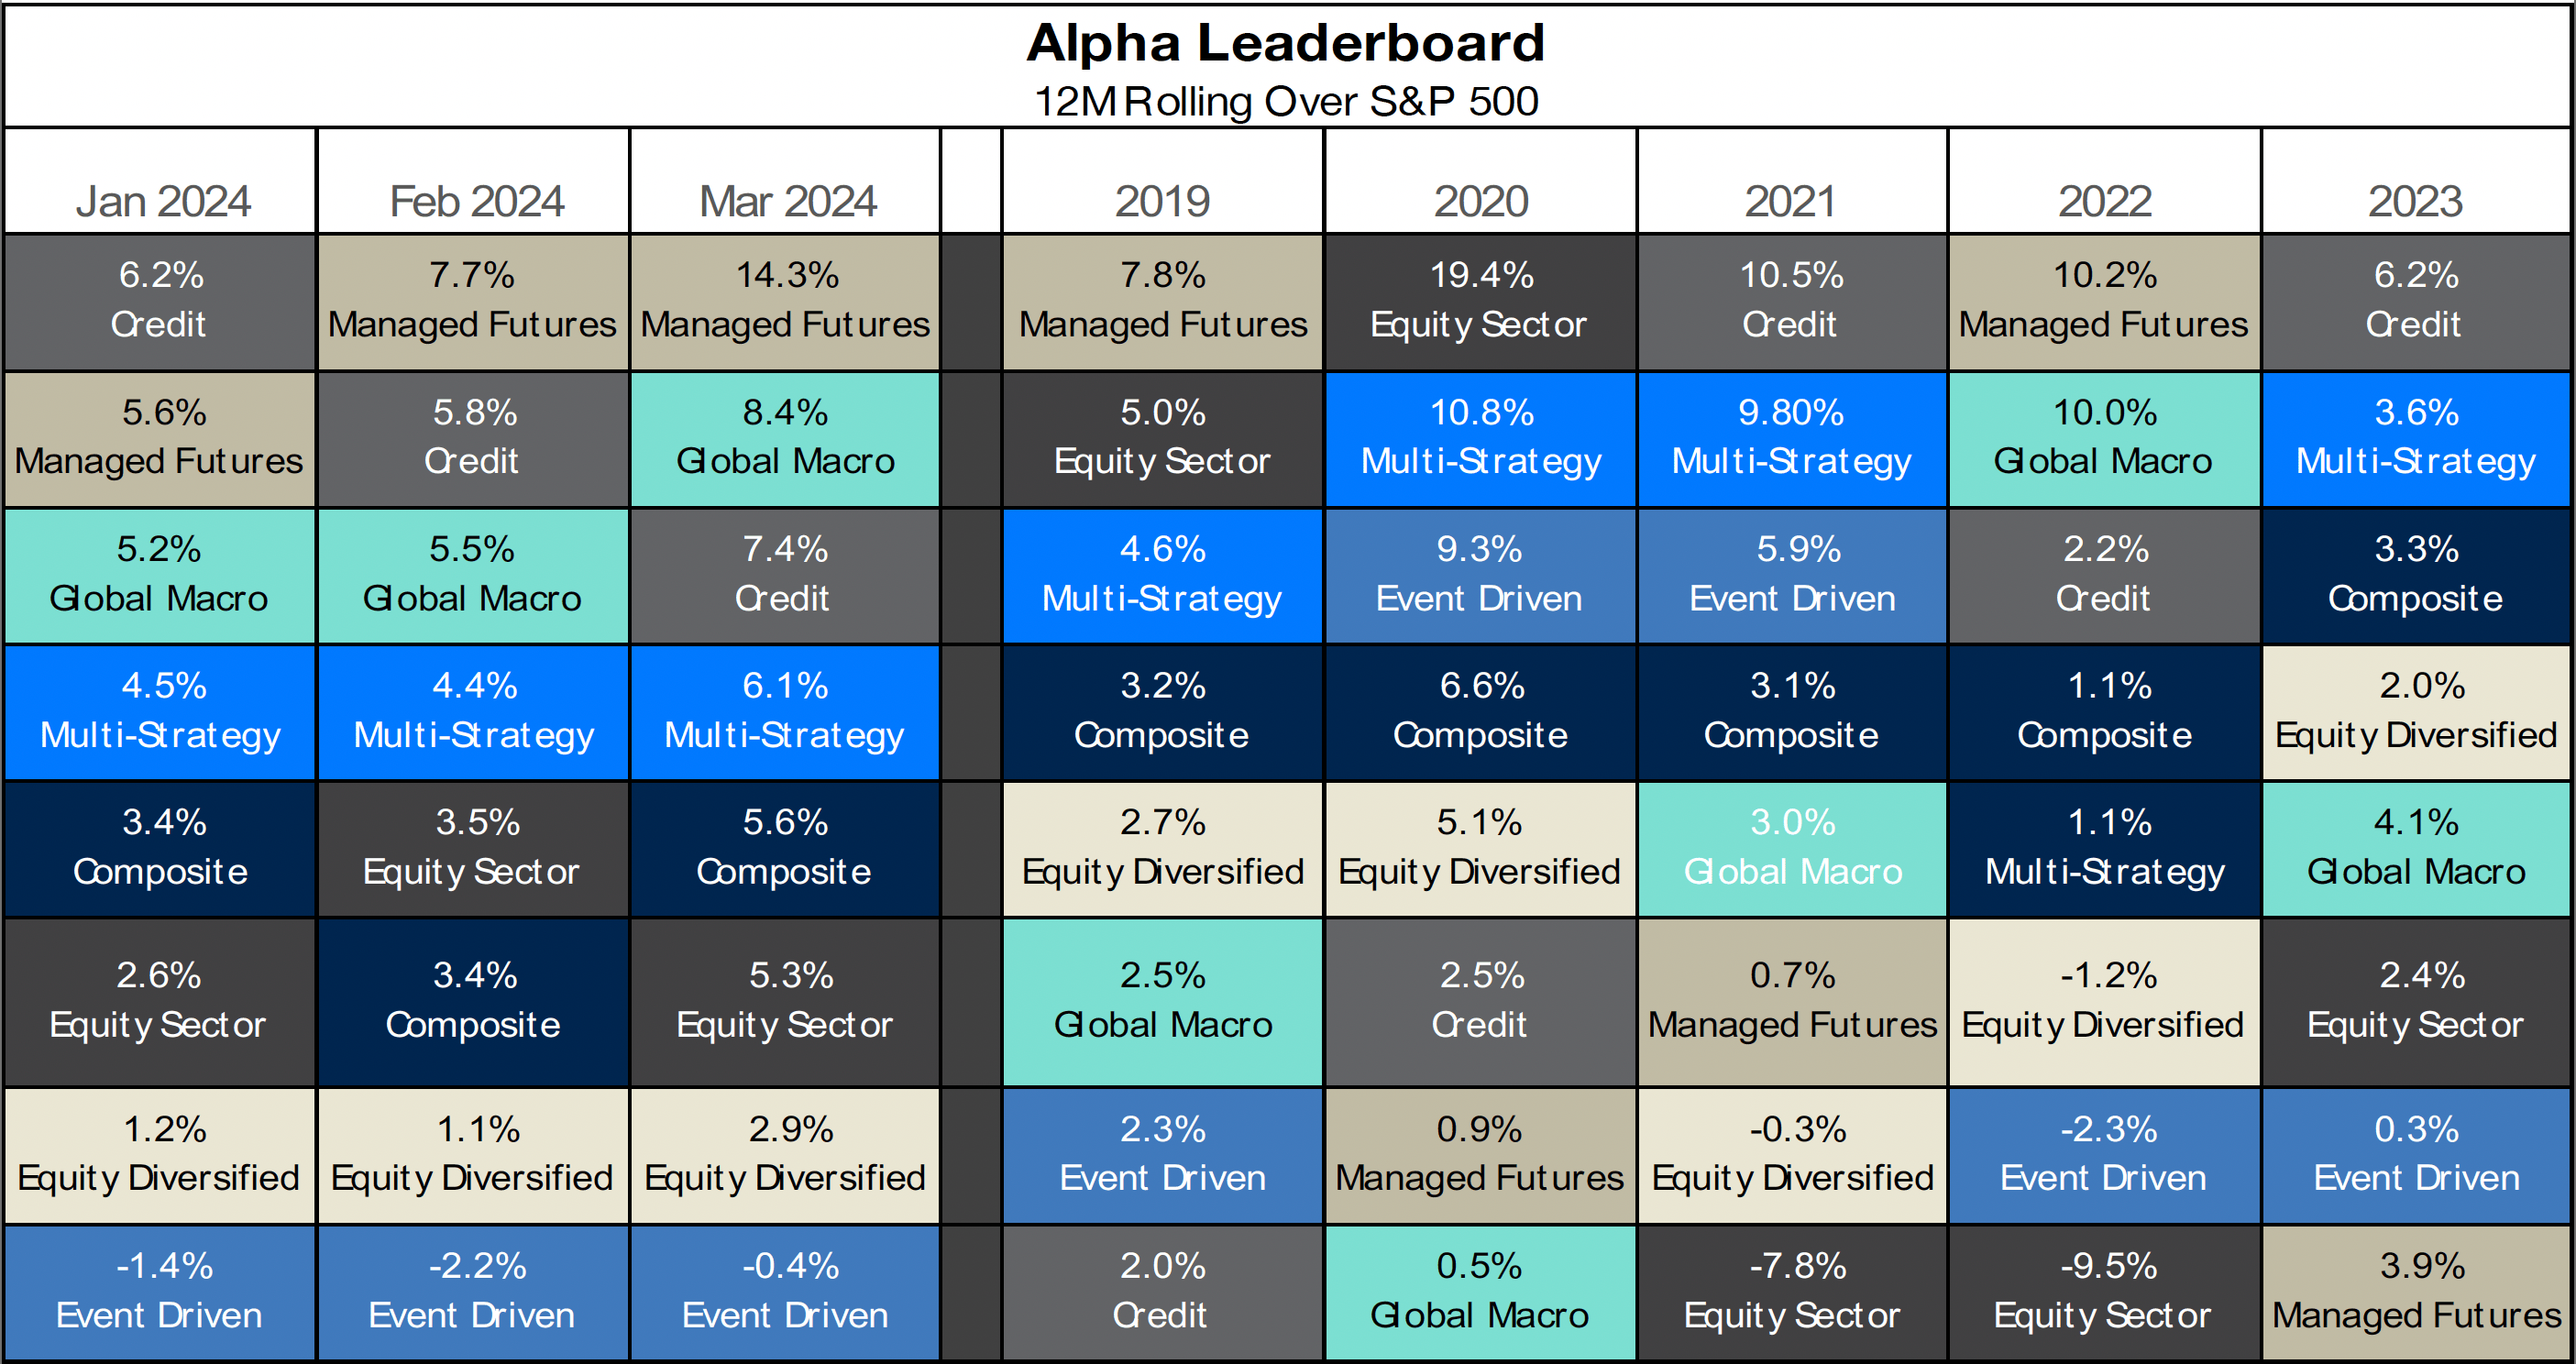
Alpha Leaderboard
- For the 12-month rolling period through March 2024, Managed Futures, Global Macro and Credit produced the highest Alpha
- Investors and managers are increasingly aligned on opportunities in Credit, with 2024 expected to be a good environment for opportunistic credit specialists, as well as an increase in allocations to credit funds.
- The Event Driven Index improved but continues to generate negative Alpha dragged down by Merger Arb.
The chart below depicts alpha generation for each PivotalPath Index, sorted from high to low. Each strategy is color-coded for easy tracking.
Managed Futures leaps back to the front of the Alpha leaderboard
Throughout 2023, we discussed Managed Futures’ rare and sizable short exposure to Treasury Futures, including a deeper dive here. While off its highs, current exposure remains in meaningful negative territory (since Feb 2021) to a level unseen since 2007. Managed Futures benefited from Treasuries selling off (rates move inversely to prices) significantly in February.
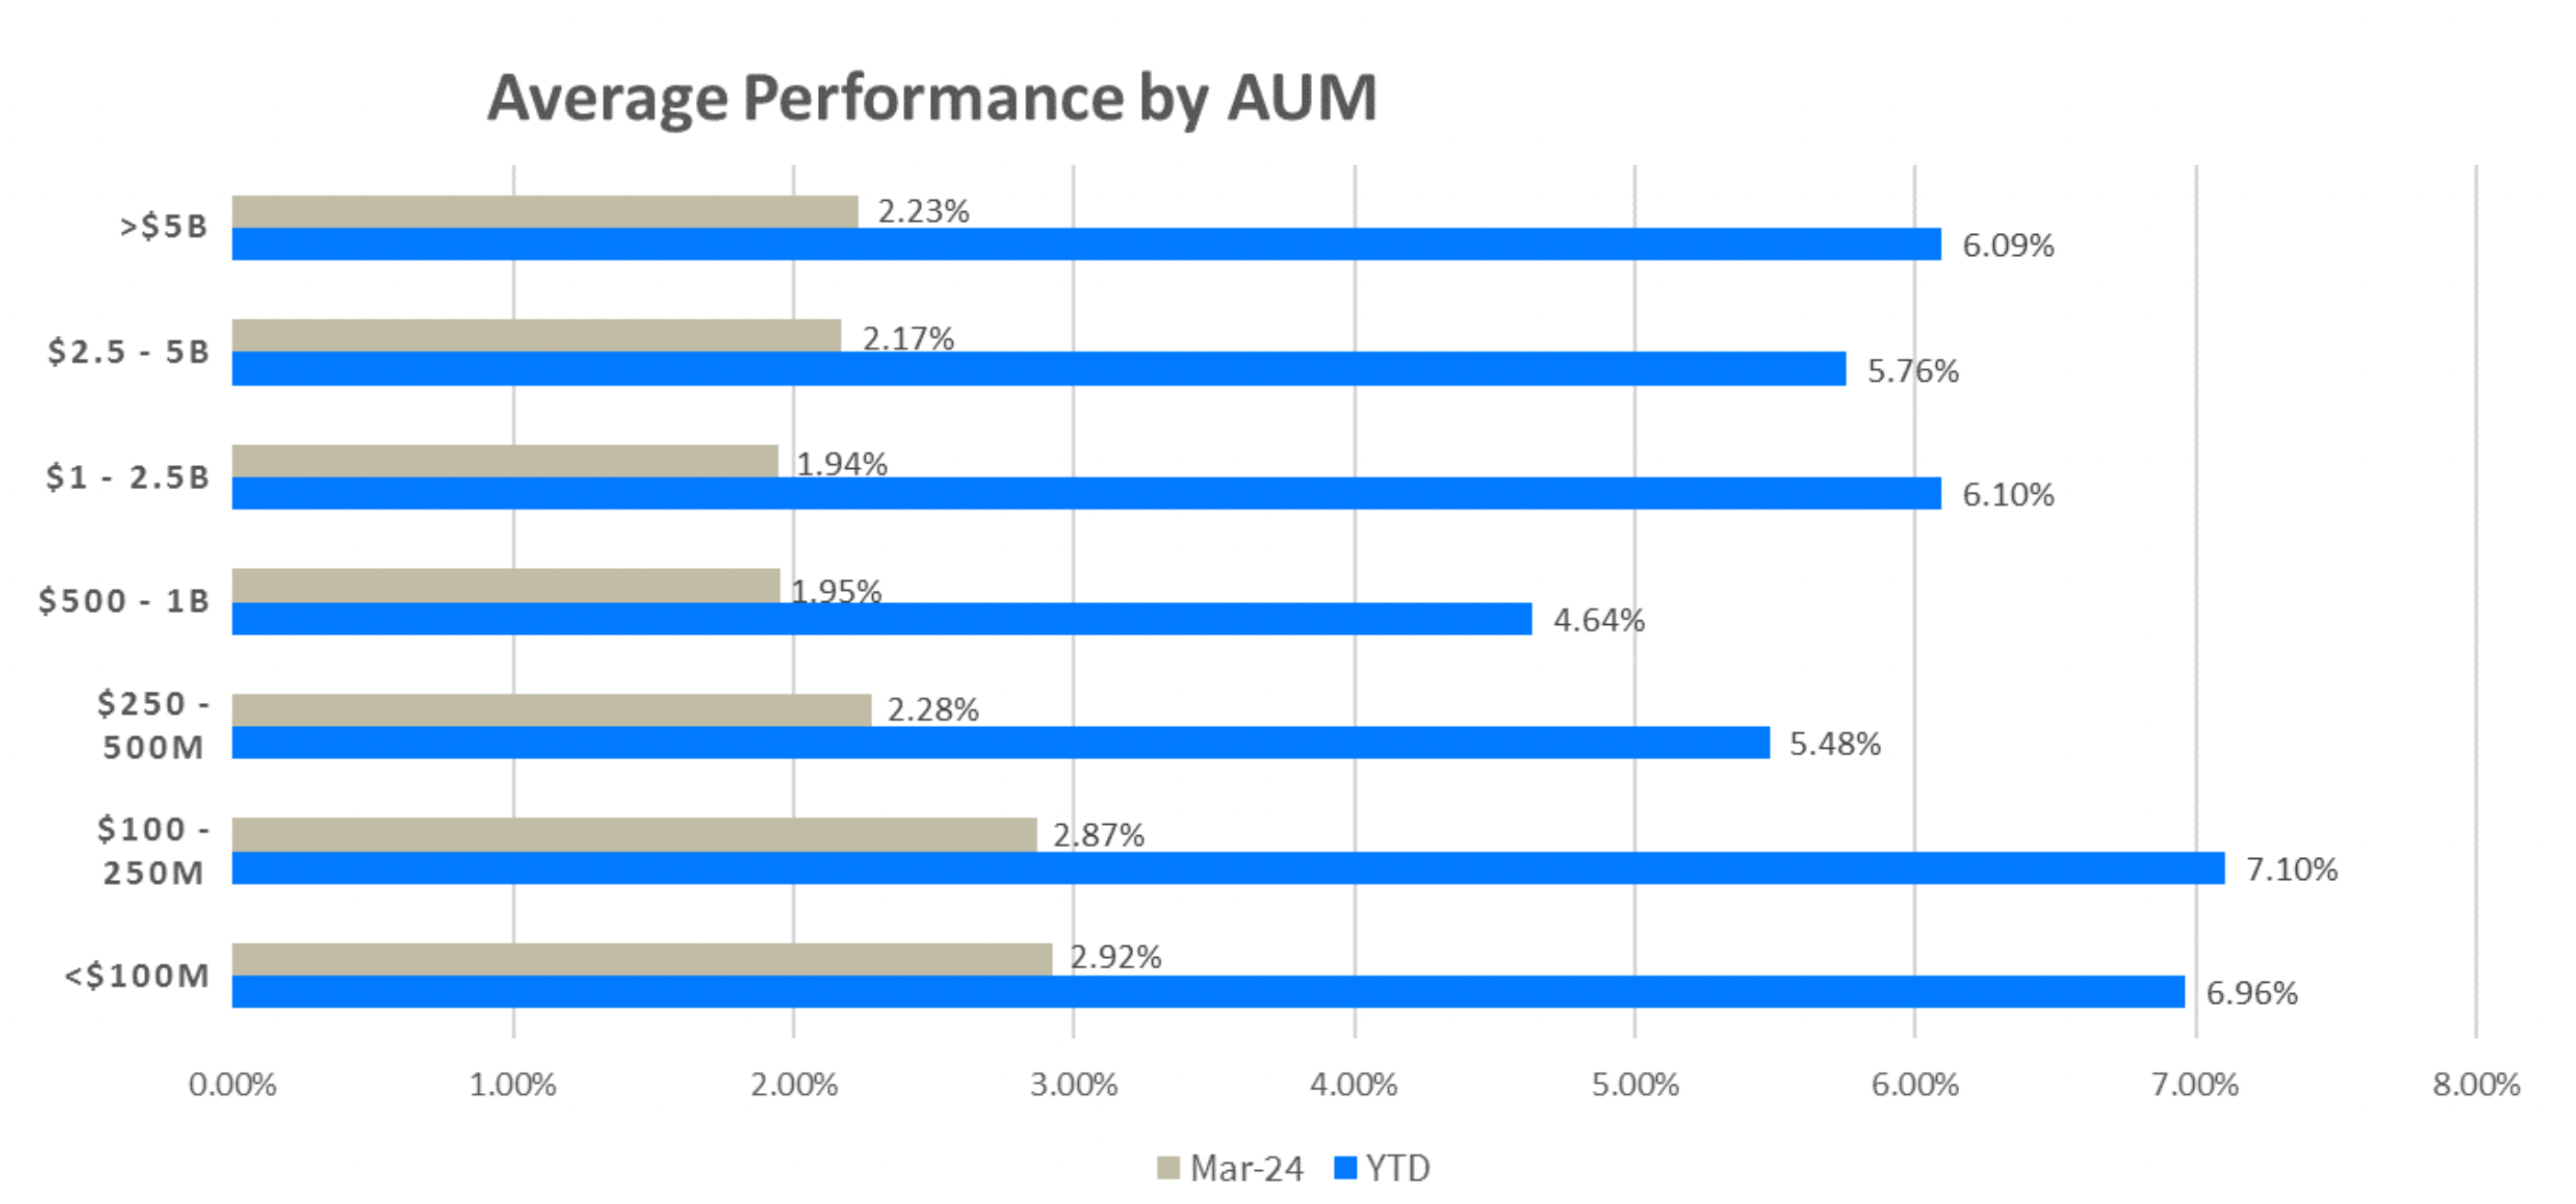
Hedge Fund Performance by AUM
- As illustrated in the graph below, on average, all AUM bands have appreciated MTD and YTD.
- In March and YTD, smaller managers (those under $500M) outperformed the other AUM bands, with average returns of approximately 7%.
- Approximately 89% of all funds reporting were positive in March and YTD. The average return of those positive is 3.0% in March and 8% YTD. The 11% of declining funds averaged losses of 2% in March and 4% YTD.