Observations:
-
For most of U.S. history, presidential elections have removed uncertainty from the markets, regardless of which party wins. As we transition to greater certainty every fourth November, generally we see hedge funds, represented by the PivotalPath Hedge Fund Composite, outperform in the 3 months following an election relative to their performance in the 3 months prior. Even during the contested election of 2000, this trend holds. What could happen if an election ushers in 3 months of greater uncertainty? We are currently investigating – we look forward to sharing an insight on this topic with you in the near term.
-
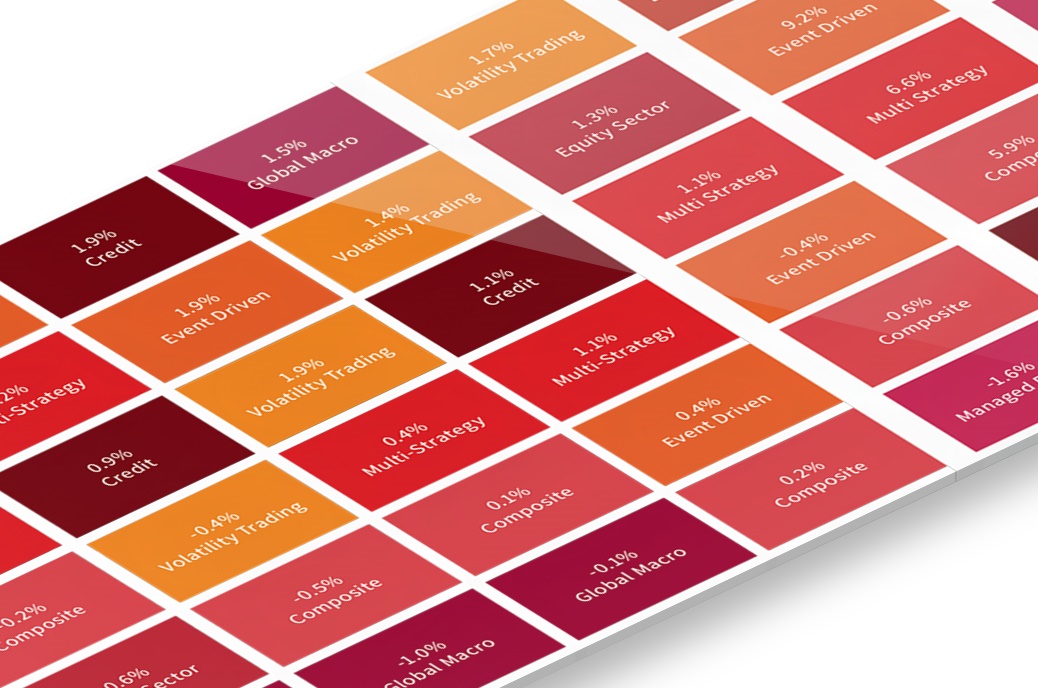
The 8 high-level hedge fund indices covered in the report, available on Bloomberg via the listed tickers, house over 40 investment sub-strategies. Several contain some of the year’s biggest winners AND losers. For instance:
-
Global Macro, down 2.1%, includes both Commodities, up 27.1%, and Risk Premia, down 12% YTD
-
Equity Sector, up 10.3%, includes both TMT, up 21.3%, and Financials, down 10.9% YTD
-
Credit, down 0.7%, includes both Convertible Bond Arbitrage, up 12.9%, and Structured Credit, down 5.4% YTD
-
-
Earlier this year, the PivotalPath Dispersion Indicator set a 1-month record in March, reaching 11.5% vs. the long-term monthly average of 2.9%, stretching back to 2000. Taken with the point above, manager selection and strategy selection have both been critically important in Q1-Q3 2020. What will Q4 bring?
-
When we look at the data through Q3 2019 vs. Q3 2020, hedge fund launches are down around 20%. Given the year that 2020 has been thus far, many would expect this number to be even lower. In 2019, ~40% of launches occurred in Q4. We will be tracking how Q4 2020 diverges from, or replicates, this phenomena.