
“Unprecedented.” It is a word used an unprecedented number of times to describe the global effects of the Covid-19 pandemic: unprecedented danger, unprecedented unemployment, or, on the positive side, unprecedented cooperation among the global scientific community.
In financial markets, March and April offer an unprecedented level of volatility packed into a mere 43 trading days. March was one of the worst months on record for the S&P 500 Index, losing 12.4%, while April was one of the best for the index, rising by 12.8%. These two months saw extreme levels of volatility across hedge funds as well. As such, these 43 days provide the perfect backdrop to study manager performance under two vastly different market regimes and serves as a microcosm regarding how to align performance expectations with manager types.
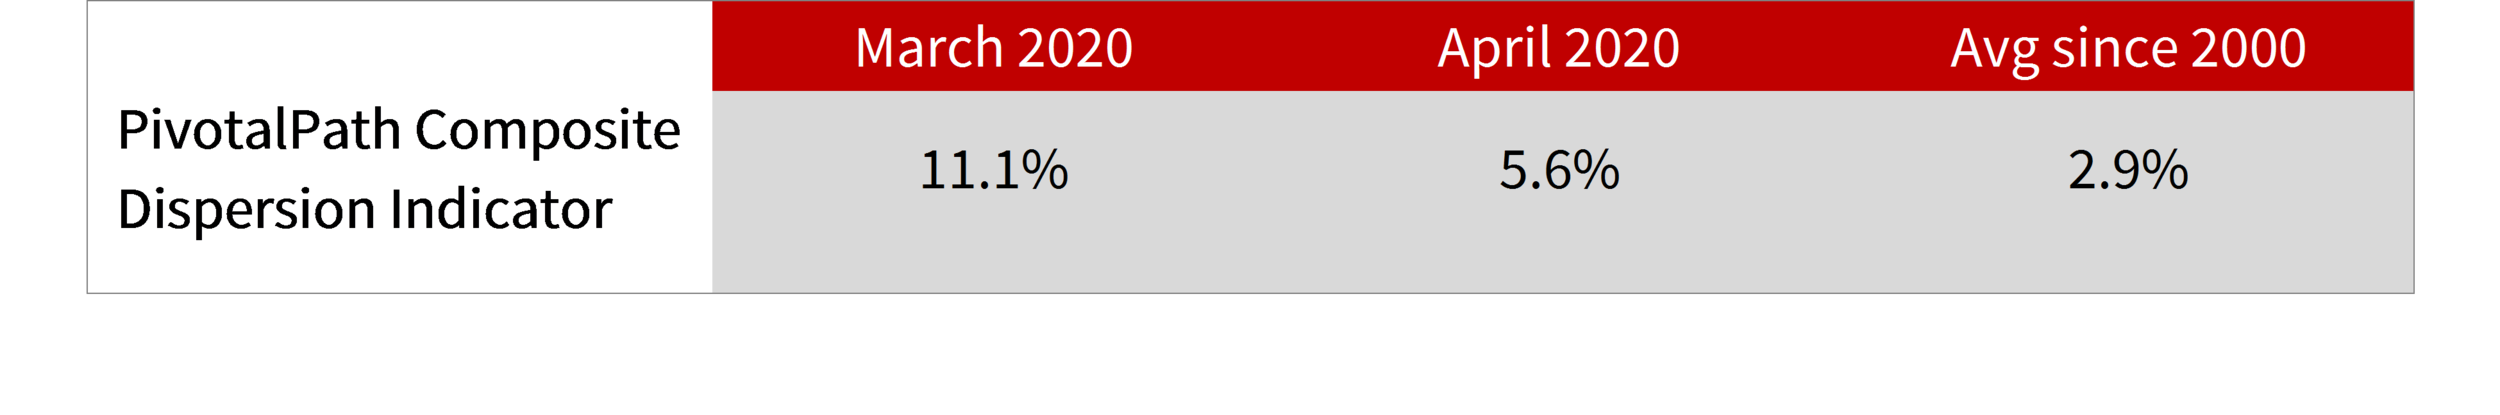
The PivotalPath Composite Dispersion Indicator, a measure of the dispersion of net returns across all funds in PivotalPath’s Hedge Fund Composite Index, hit a historic high of 11.1% in March 2020, 4x its monthly average going all the way back to January 2000. In April, dispersion came down a bit, but remained at the higher end of historical levels. The previous high for dispersion was in October 2008, when the indicator hit 9.0%.
What does this dispersion look like on the manager level? In March, the best performing fund was up 71.3% while the worst was down 88.0%. In April, a month biased toward the upside, the best performing fund was up 53.5% while the worst was down 15.4%. Only 13% of funds were up in both months. Instead, funds that made money in March were down in April, and vice-versa.
Of course, raw performance is only a piece of the puzzle. “Quality of performance” over the long term is what truly matters. For investors, it’s not just how managers perform in a given month that garners their attention. Instead, it is how consistently managers generate alpha, minimize drawdowns and perform relative to their peers that ultimately drives allocations. That’s why we systematically rank each of these 3 criteria at year end, locking in top quartile performers (“TQP” or high-quality managers) and bottom quartile performers (“BQP” or low-quality managers), for the subsequent year. Since January of 2000, when we look at the difference between TQP and BQP, we see an average of 3.3% of outperformance the following year (or an average of 28bps / month) – these rankings are actually predictive of future performance.
In March, 1.8% separated TQP from BQP, a result in line with expectations. However, in April, TQP underperformed BQP by -2.2%. Why? March was about quality; April was all about that beta.
As we discussed in a recent piece, the quality factor outperformed in March. In April, the reverse was true, as quality underperformed while lower quality/higher leverage led outperformance for the month in what can be termed a “beta rally”. The Dow Jones Market Neutral Quality Index, which was up 11.9% in March, was down slightly in April, losing 0.3%, while most other risk factors were up.
This same quality factor helps explain fund performance in April as well.
Overall, funds that were up the most in April were down the most in March.

Quartiles based on April return
Looked at another way, the funds that did the best in March were the worst performers in April.

Quartlies based on March return
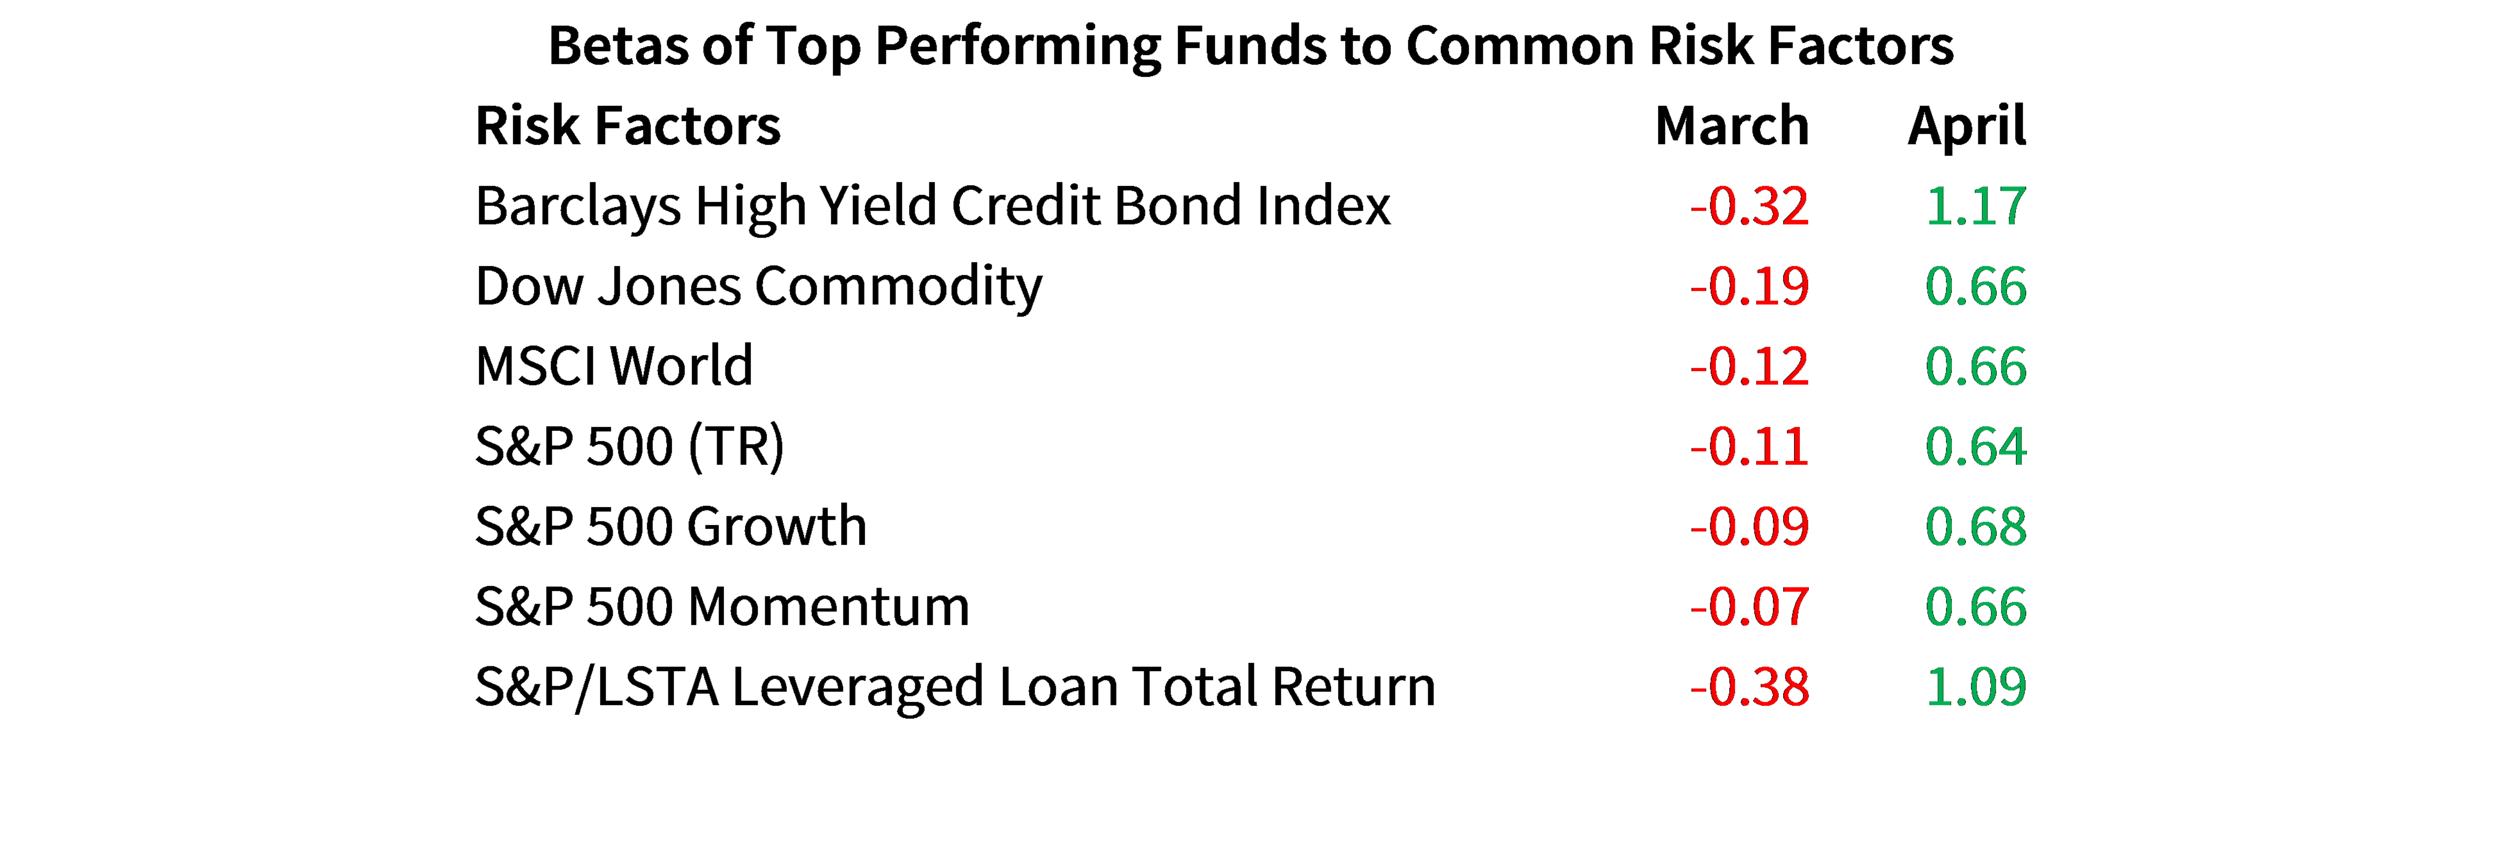
When we look at March outperformers, we see they had negative to low betas, or exposure, to most risk factors. Meanwhile, funds that outperformed in April had high betas, or exposure, to factors associated with leverage (a proxy for lower quality). This is in-line with what we’d expect to see during a market downturn, followed by the “beta rally” we saw in April.
While most funds were up in April, the rally only gained back about half of March losses as the PivotalPath Composite Index was up 3.2% in April after losing 6.6% in March. In fact, the worst performing sub-strategy in March (European activist) was the best performing sub-strategy in April, though its 13.3% return in April was much lower than its 30.2% loss in March.
May might be a chance for funds to continue to make up Q1 2020 losses. Most market indices and risk factors are positive through month end, though not as much as they were in April. Additionally, quality is back as the Dow Jones Market Neutral Quality Index is up 1.7% through the end of May.
As always, we’ll be following our universe of 2,000+ institutional hedge fund managers closely, analyzing long-term, predictive performance drivers for the remainder of 2020 and beyond. If this high volatility environment continues, we expect to see continued dispersion in returns and thus, more importance assigned to manager selection. Over the long term, we remain confident that high-quality mangers, as defined by our rankings, will continue to meaningfully outperform their lower-quality peers.